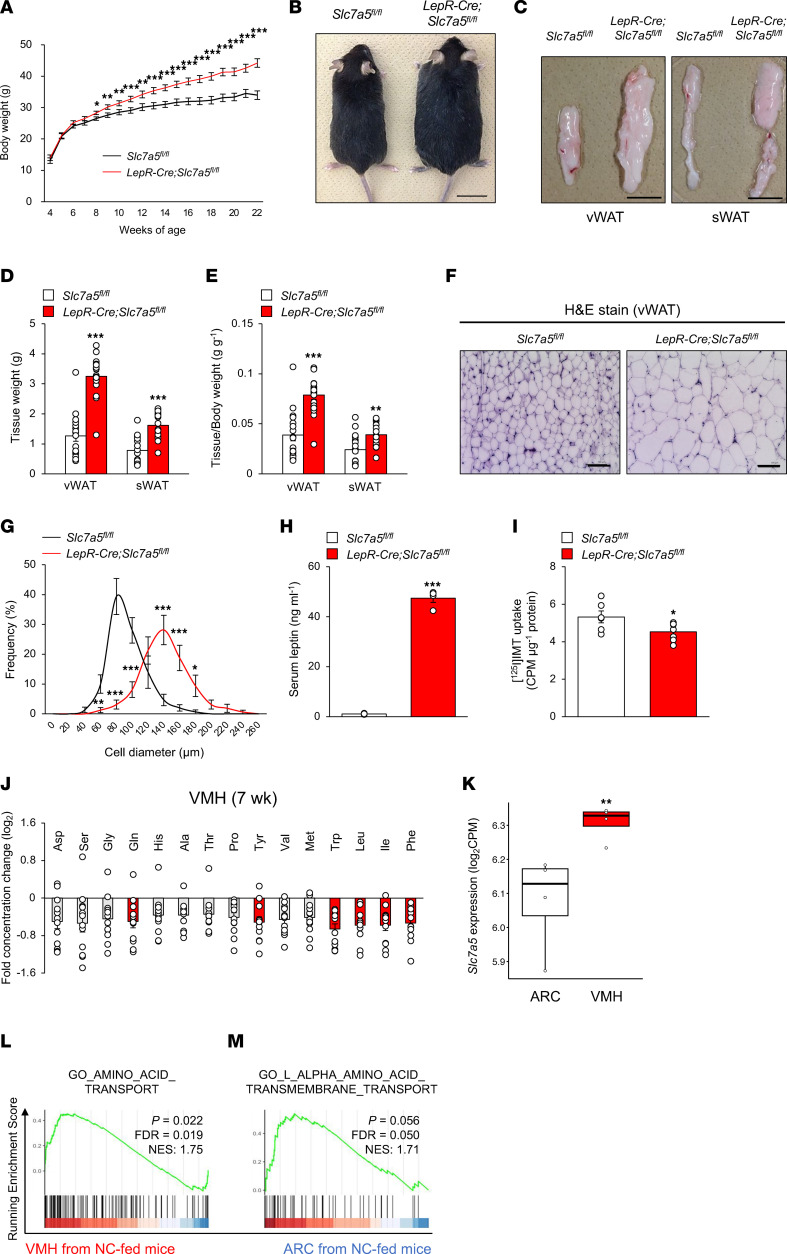
Figure 2. LAT1 in LepR-expressing neurons plays a critical role in the maintenance of proper body weight and adequate amino acid level balance.
(A) Weekly body weight is shown for LepR-Cre Slc7a5fl/fl mice and control mice fed an NC (n = 8 or 9, *P < 0.05, **P < 0.01, ***P < 0.001, 2-way ANOVA with Bonferroni post hoc test). (B) Gross appearance at 24 weeks of age is shown for LepR-Cre Slc7a5fl/fl mice and control mice fed an NC. Scale bar, 1 cm. (C–E) Representative pictures of visceral and subcutaneous WAT (vWAT and sWAT) (C), adipose tissue weights (D), and adipose tissue weights normalized to body weight (E) are shown for LepR-Cre Slc7a5fl/fl mice and control mice at 22–24 weeks of age (n = 17 or 18, **P < 0.01, ***P < 0.001, 2-tailed Student’s t test). Scale bar, 1 cm. (F and G) H&E stain was performed on the vWAT of LepR-Cre Slc7a5fl/fl mice and control mice at 22–24 weeks of age, followed by quantification of adipocyte size of vWAT (n = 15 or 16, *P < 0.05, **P < 0.01, ***P < 0.001, 2-way ANOVA with Bonferroni post hoc test). Scale bar, 100 μm. (H) Serum leptin levels were measured in LepR-Cre Slc7a5fl/fl mice at 22–24 weeks of age (n = 4, ***P < 0.001, 2-tailed Student’s t test). (I) [125I]IMT uptake in hypothalamus from LepR-Cre Slc7a5fl/fl mice at 22–24 weeks of age (n = 6 or 7, *P < 0.05, 2-tailed Student’s t test). (J) Log2 ratio of the amino acid levels in VMH between LepR-Cre Slc7a5fl/fl mice and control mice at 7 weeks of age (n = 12, the amino acids with P < 0.05 are represented in red, 2-tailed Student’s t test). (K) Quantification of Slc7a5 mRNA in ARC and VMH of mice fed an NC (n = 4, **P < 0.01, Fisher’s exact test). (L and M) The enrichment plots for amino acid transport-related gene sets in VMH and ARC of mice fed an NC (n = 4). All the mice used in this study were male.

