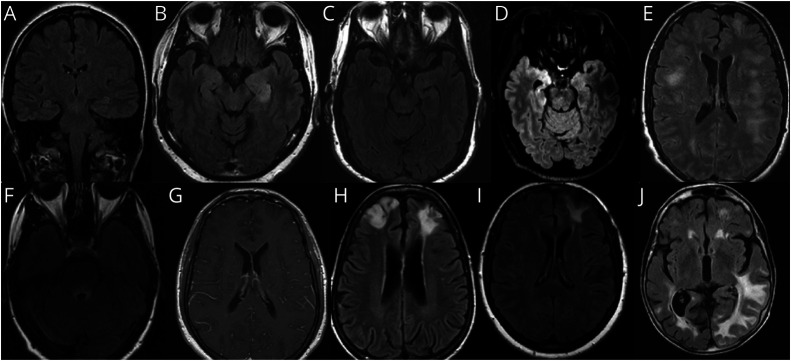
Figure 4. Illustrative MRI Brain Findings.
Images are T2 axial FLAIR, except A (T2 coronal FLAIR) and G (T1 axial postgadolinium). (A) Normal appearing hippocampal formations in a patient with anti–NMDA-receptor encephalitis. (B) Bilateral hyperintensity of hippocampal formations in a patient with LGI1 encephalitis. (C) Subtle left hippocampal hyperintensity in a patient with LGI1 encephalitis. (D) Prominent right amygdalar hyperintensity in a patient with anti-Ma2 encephalitis. (E) Multifocal white matter lesions with ill-defined borders in a patient with MOG antibody–associated disease and an ADEM attack. (F) Peri-IVth ventricular hyperintensity in a patient with aquaporin-4-IgG–positive neuromyelitis optica spectrum disorder with brainstem encephalitis; (G) Periventricular leptomeningeal enhancement in a patient with autoimmune GFAP astrocytopathy. (H) Bifrontal lobar hyperintensities in a patient with GABAA receptor encephalitis. (I) Left frontal hyperintensity in a patient with possible autoimmune encephalitis. (J) Diffuse T2 signal abnormalities in a patient with probable autoimmune encephalitis. ADEM = acute disseminated encephalomyelitis; FLAIR = fluid-attenuated inversion recovery; GABA = gamma amino butyric acid; GFAP = glial fibrillary acidic protein; LGI1 = leucine-rich glioma-inactivated 1; MOG = myelin oligodendrocyte glycoprotein; NMDA-R = n-methyl-d-aspartate receptor.

