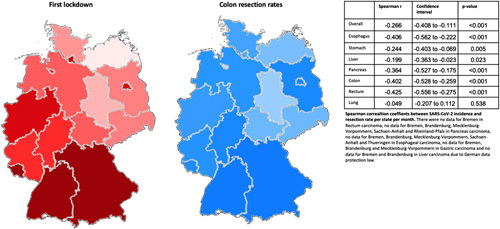
Figure 4.

The impact of the first lockdown per state within Germany. Higher incidences are depicted in darker red. Coronavirus disease incidences per month and state in Supplementary Table 6. High resection rates in brighter blue and darker blue designate lower (‘higher reduction’) resection rates. Resection rates are depicted for colon resections. Correlation factors with 95% CI are in the accompanying table. The second lockdown is in Supplementary Figure 3. SARS-CoV-2, severe acute respiratory syndrome coronavirus 2.
