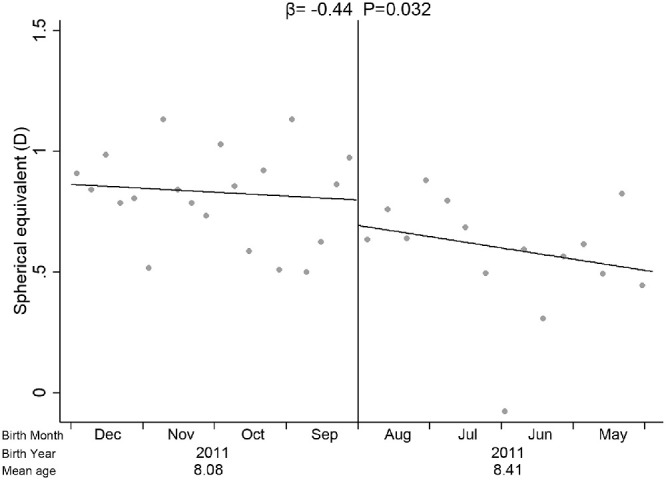
Figure 3.

The casual analysis of the effect of education on spherical equivalent by using regression discontinuity analysis between Grade 2 and Grade 3. Solid line, local linear regression line by different blocks; solid vertical line, the cut-off across Grade 2 and Grade 3. Dots denote observed bins.
