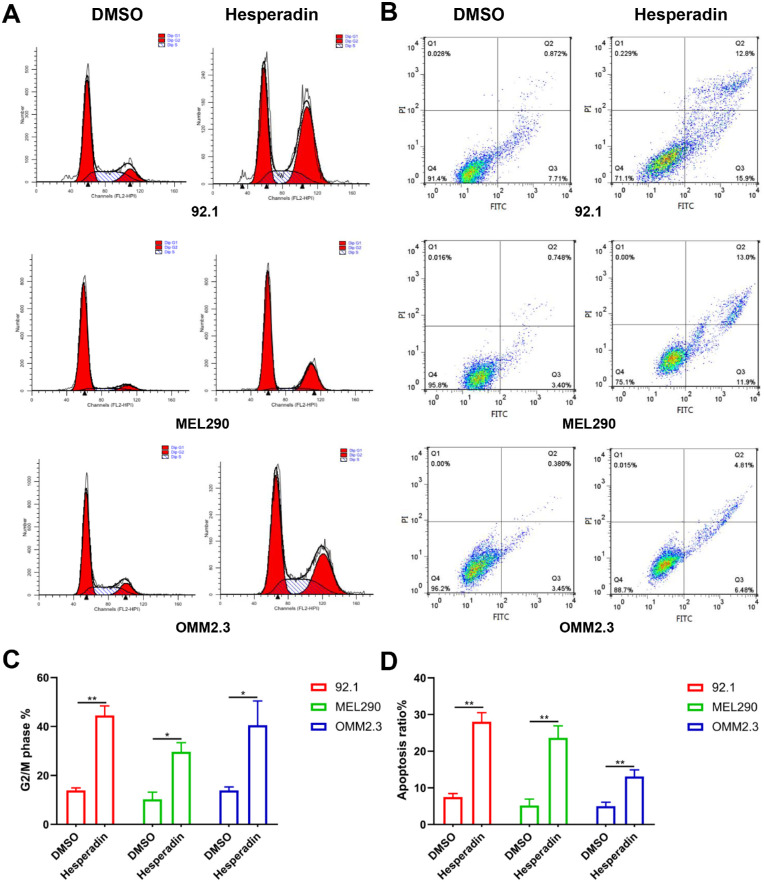
Figure 3.
Hesperadin-induced UM cell cycle arrest and apoptosis. (A) 92.1, MEL290, and OMM2.3 cells were treated with 0 and 0.3 µM hesperadin. After 24 hours, the cells were collected and stained with PI. Then, the cell cycle distribution was measured using flow cytometry. (B) Cells were also stained with Annexin V-FITC/PI and measured using flow cytometry. The living cells were located in the lower left quadrant. (C) Quantification of cells in the G2/M phase. (D) Quantification of early and late apoptotic cells located in the lower and upper right quadrants. Statistical analysis was conducted using GraphPad Software 8.0.1. Data were presented as the mean ± SD. In addition, the significant difference between the treated and the control was tested by the Student t-test. *P < 0.05; **P < 0.01.

