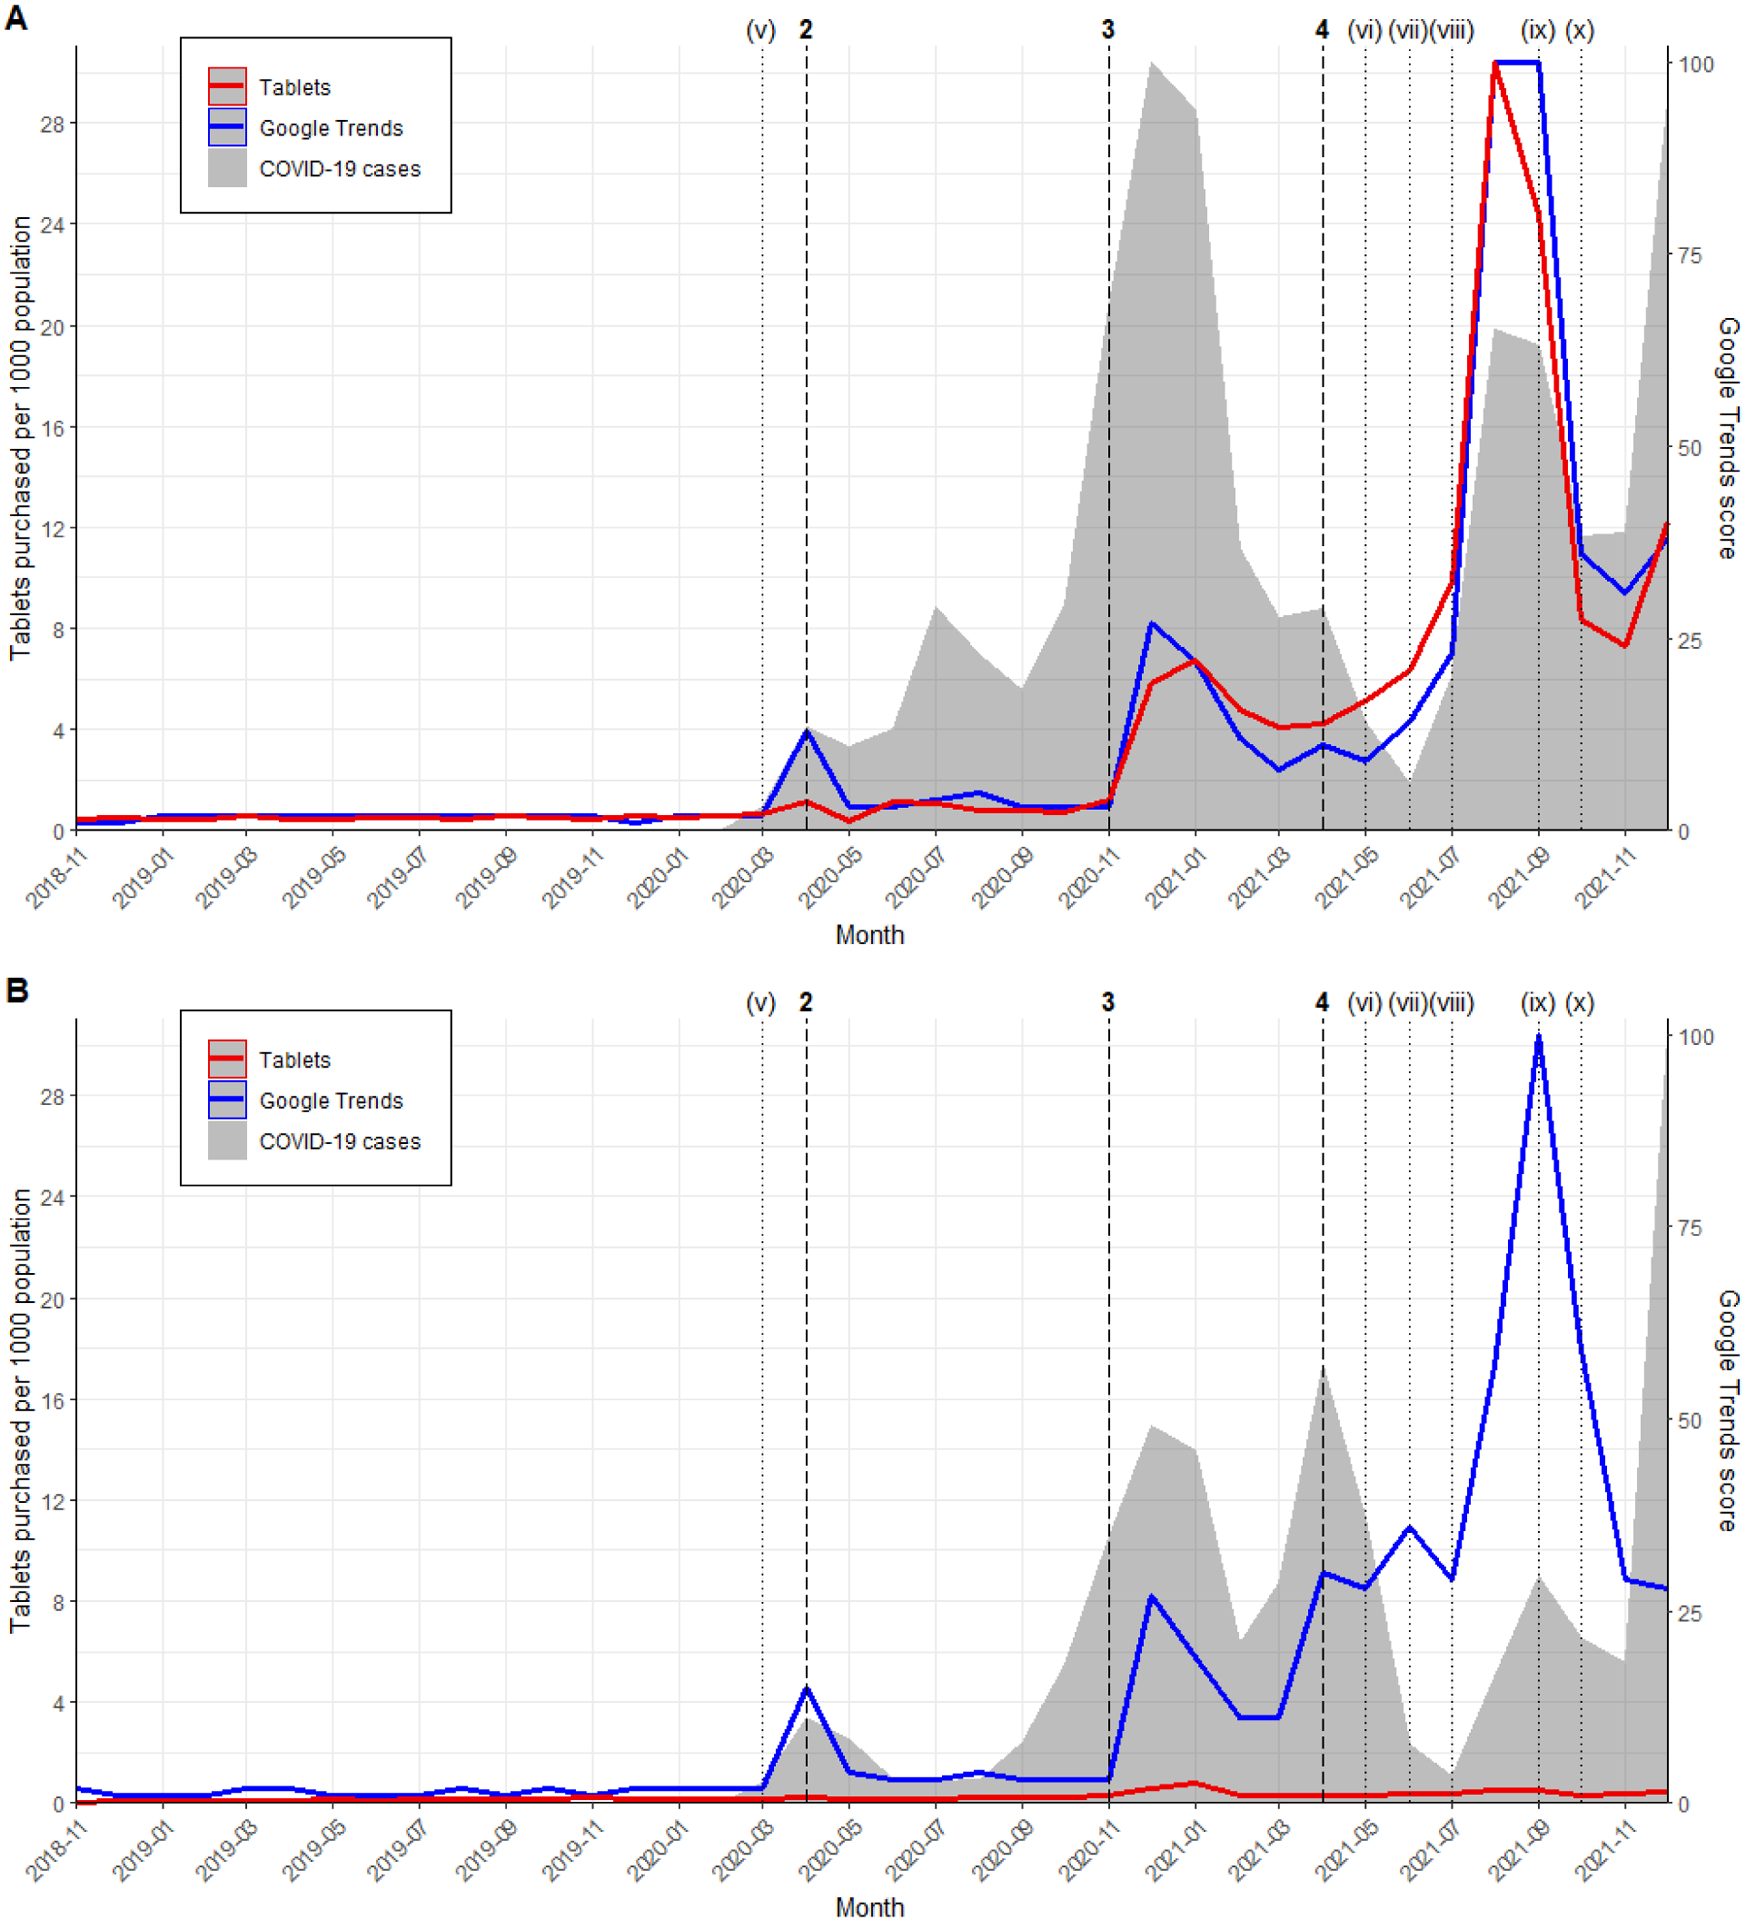
Figure 2. Population-adjusted ivermectin purchasing rates, Google Trends, and COVID-19 case rates in (A) the United States and (B) Canada.

The Google Trends score ranges from 0 to 100. The y-axes for COVID-19 case rates are not shown, but cases in the U.S. began in January 2020 and peaked in December 2020 (19.8 per 1000 population). COVID-19 cases in Canada began in January 2020 and peaked in December 2021 (11.1 per 1000 population). Vertical lines represent major events such as in vitro studies, clinical studies, review articles, and public announcements (details in Table 2). Figure S1 in the supplement is an expanded view of Figure 2B.
