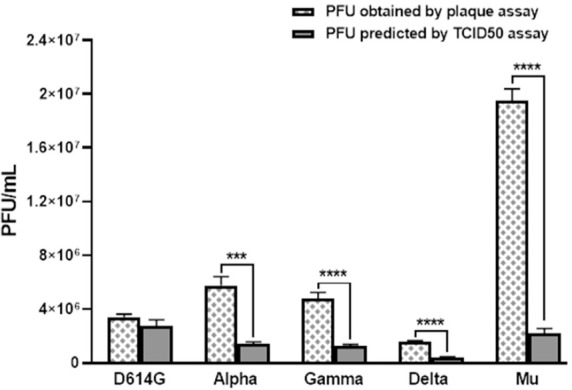
Fig. 2.

Comparison between SARS-CoV-2 titer (PFU/mL) by TCID50 and plaque assay. The viral titer (PFU/mL) predicted by TCID50 and obtained by plaque assay for D614G strain and the Alpha, Gamma, Delta and Mu variants. Bars with error bars represent the mean ± Standard Error (SE) of five independent experiments. t Student or Mann-Whitney U test were performed to compare the viral titers obtained by plaque assay and predicted PFU/mL by TCID50 assay in each variant. ***p ≤ 0.001, ****p ≤ 0.0001.
