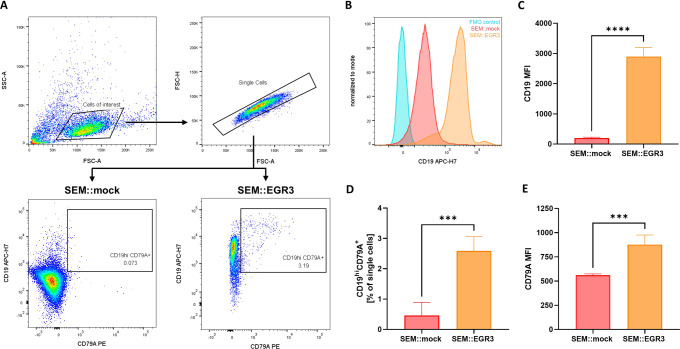
Fig. 2. Flow cytometric analysis of SEM::EGR3 and SEM::mock.
A Gating strategy. Single cells were gated out of cells of interest for assessment of CD19 and CD79A surface expressions. Analyses were performed based on four biological replicates. B Exemplary histogram of CD19 fluorescence intensities of a full-fluorescence-minus-anti CD19 (FMO) control (blue), SEM::mock (red) and SEM::EGR3 (orange). Plots display the respective single cell populations and were normalized to mode. C CD19 median fluorescence intensities (MFI) of SEM::mock and SEM::EGR3 singlets. Significance was tested using a two-tailed t test (p < 0.0001). Error bars indicate standard deviation. D Mean percentages of the CD19hiCD79A+ population relative to singlets. Error bars indicate standard deviation and significance was tested using a two-tailed t test (p = 0.0006). E CD79A median fluorescence intensities (MFI) of the CD19hiCD79A+ populations of SEM::mock and SEM::EGR3. Significance was tested using a two-tailed t test (p = 0.0008). Error bars indicate standard deviation.

