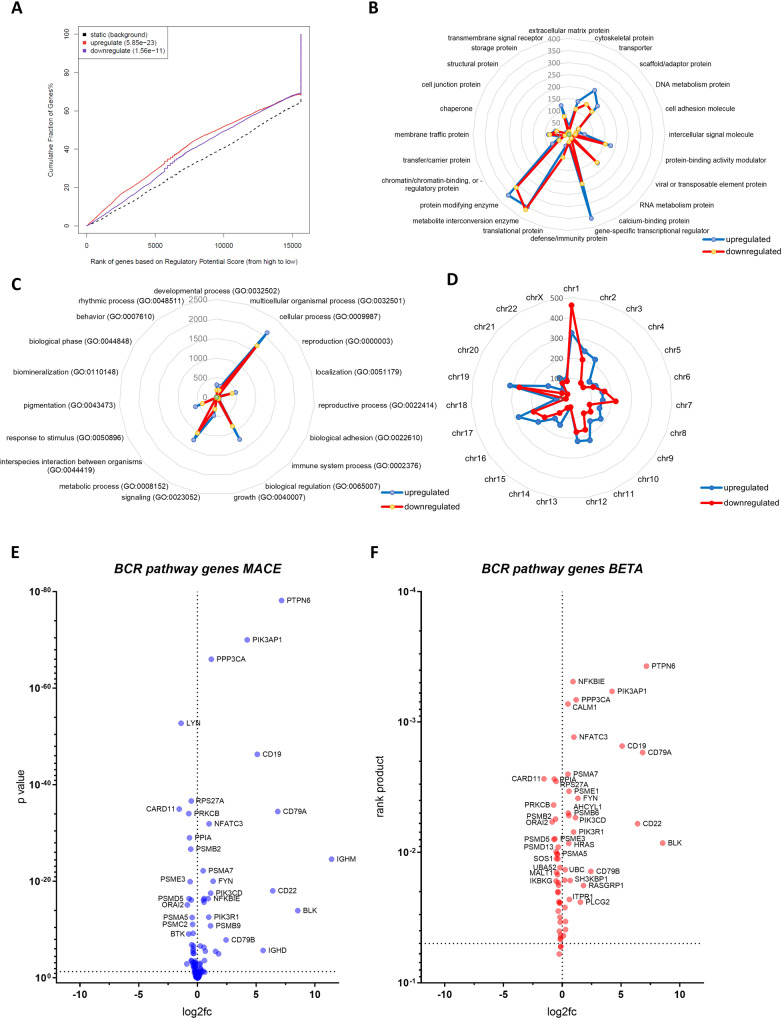
Fig. 3. Integration of MACE-Seq and ChIP-Seq data revealed the EGR3 regulome of infant KMT2A::AFF1 ALL.
A Assignment of gene ranks to the cumulative fraction of genes using BETA identifies EGR3 as a direct activator and repressor of target genes. Analysis of the EGR3 regulome using the PANTHER database with up- and downregulated target genes subclassified considering their corresponding protein class (B), biological function/GO term (C) and chromosomal location (D). Numbers indicate the count of up- (blue) and downregulated (red) genes. E Volcano plot visualizing genes of the Reactome BCR geneset according to their differential expression indicated as the log2-fold change (log2fc) and p value (MACE-Seq data). F Volcano plot visualizing genes of the Reactome BCR geneset according to their differential expression (log2fc) and direct EGR3 regulation (rank product) (MACE-Seq and BETA data).

