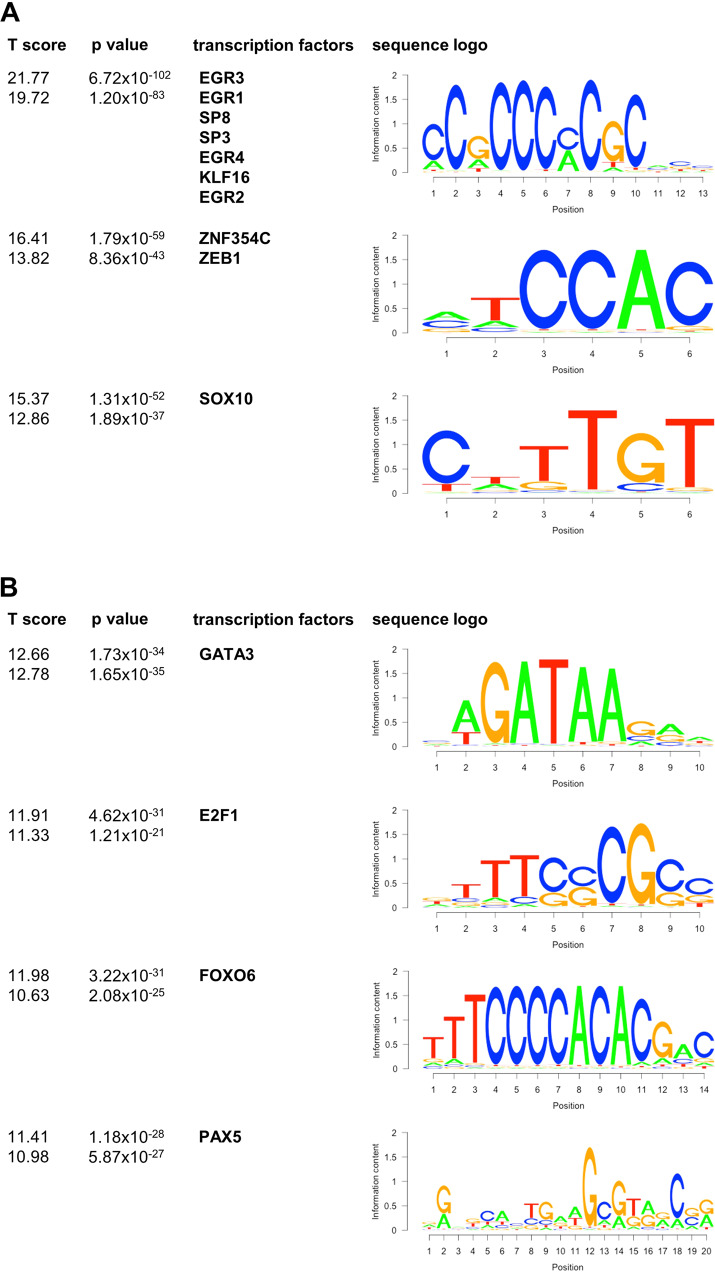
Fig. 4. Motif scanning of all differentially expressed genes.
A Motif scanning result of all direct EGR3 target genes. T score, p value, transcription factor and sequence logo were identified using BETA plus. Upper T score and p value apply to upregulated genes, lower T score and p value apply to downregulated genes. B Motif scanning result of differentially expressed but not directly EGR3-regulated genes. T score, p value, transcription factor and sequence logo were identified by BETA plus. Upper T score and p value apply to upregulated genes, lower T score and p value apply to downregulated genes.

