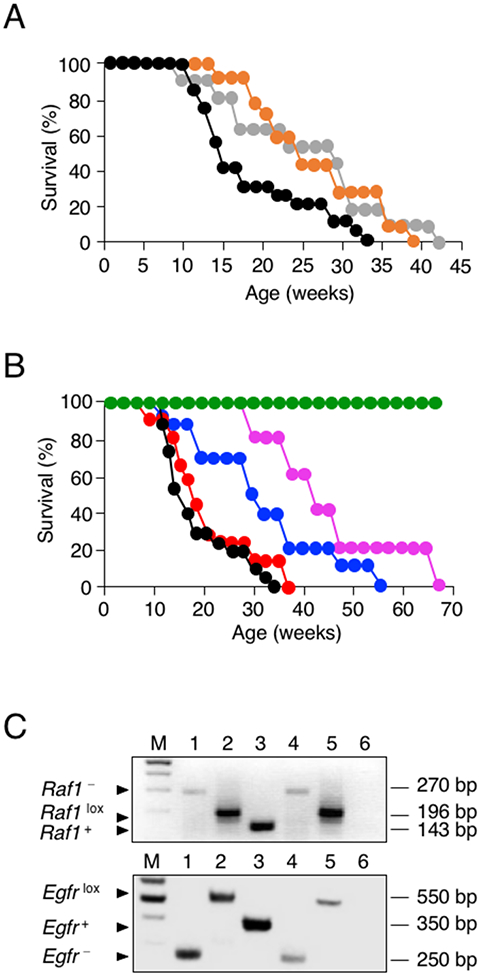
Figure 1. Effect of Egfr, Raf1 and Cdk4 targeting on PDAC development.

(A) Survival of control KPeC (black, n=20), KPeC;Cdk4K35M/K35M (orange, n=14), and KPeC;Egfrlox/lox;Cdk4K35M/K35M (gray, n=11) mice. All mice died of PDAC tumors at the indicated times.
(B) Survival of control KPeC (black, n=20), KPeC;Raf1lox/lox (red, n=13), KPeC;Egfrlox/lox;Raf1+/lox (blue, n=10), KPeC;Egfr+/lox;Raf1lox/lox (pink, n=5) and KPeC;Egfrlox/lox;Raf1lox/lox (green, n=14) mice. All mice died of PDAC tumors at the indicated times.
(C) PCR analysis of Egfr and Raf1 alleles using DNA extracted from laser captured acinar cells expressing K-RASG12V (identified by the X-Gal marker). Migration of recombined Egfr− and Raf1− alleles (lane 1), conditional Egfrlox and Raf1lox alleles (lane 2) and wild-type Egfr+ and Raf1+ alleles (lane 3) used as controls. DNA extracted from X-Gal positive (lane 4) and negative (lane 5) acinar cells of KPeC;Egfrlox/lox;Raf1lox/lox mice. Lane 6, blank control. Lane M, DNA size markers. DNA fragment size is indicated.
