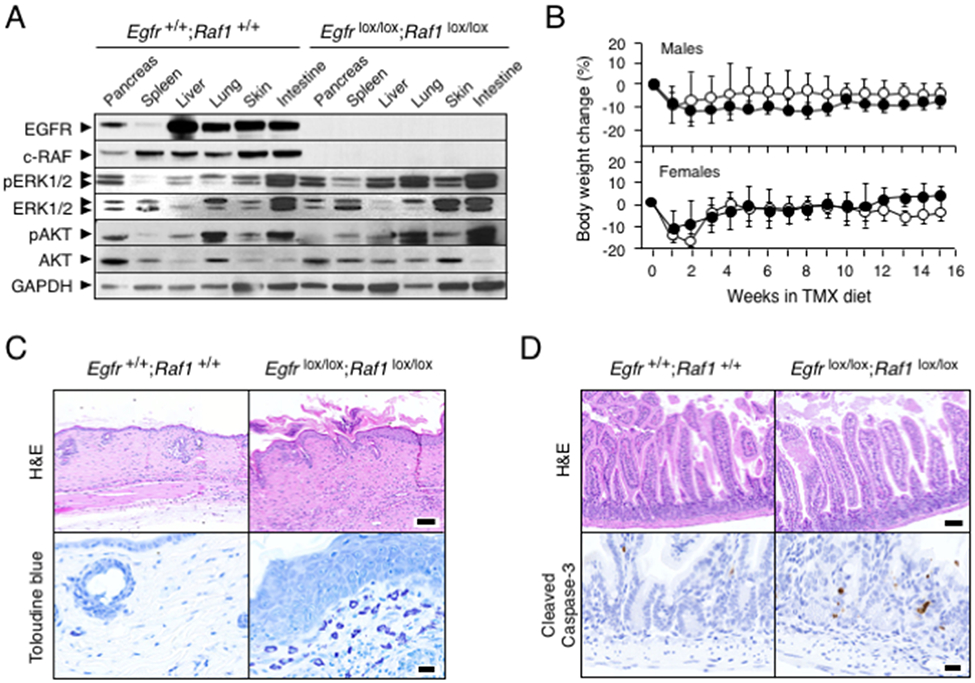
Figure 2. Ablation of EGFR and c-RAF expression induces acceptable toxicities.

(A) Western blot analysis of EGFR, c-RAF, pERK1/2, ERK1/2, pAKT and AKT expression in tissues obtained from Egfr+/+;Raf1+/+;Tg.UBC-CreERT2 and Egfrlox/lox; Raf1lox/lox;Tg.UBC-CreERT2 mice after 3 weeks of TMX exposure. GAPDH served as a loading control.
(B) Body weight change in Egfr+/+;Raf1 +/+;Tg.UBC-CreERT2 (solid circles, n=5) and Egfrlox/lox;Raf1lox/lox;Tg.UBC-CreERT2 mice (open circles n=5) exposed to TMX for the indicated length of time. Error bars indicate mean ± SD.
(C) Representative H&E and Toluidine-blue staining of skin sections from Egfr+/+;Raf1+/+;Tg.UBC-CreERT2 and Egfrlox/lox;Raf1lox/lox;Tg.UBC-CreERT2 mice exposed to TMX for 15 weeks. Scale bars represent 100 μm (H&E) and 20 μm (toluidine blue).
(D) Representative H&E and cleaved Caspase-3 staining in sections of small intestine of Egfr+/+;Raf1+/+;Tg.UBC-CreERT2 and Egfrlox/lox;Raf1lox/lox;Tg.UBC-CreERT2 mice exposed to TMX for 15 weeks. Scale bars represent 100 μm (H&E) and 20 μm (cleaved Caspase-3).
