
Figure 5. Differential proliferative properties of PDAC cells lines upon ablation of EGFR and c-RAF expression.
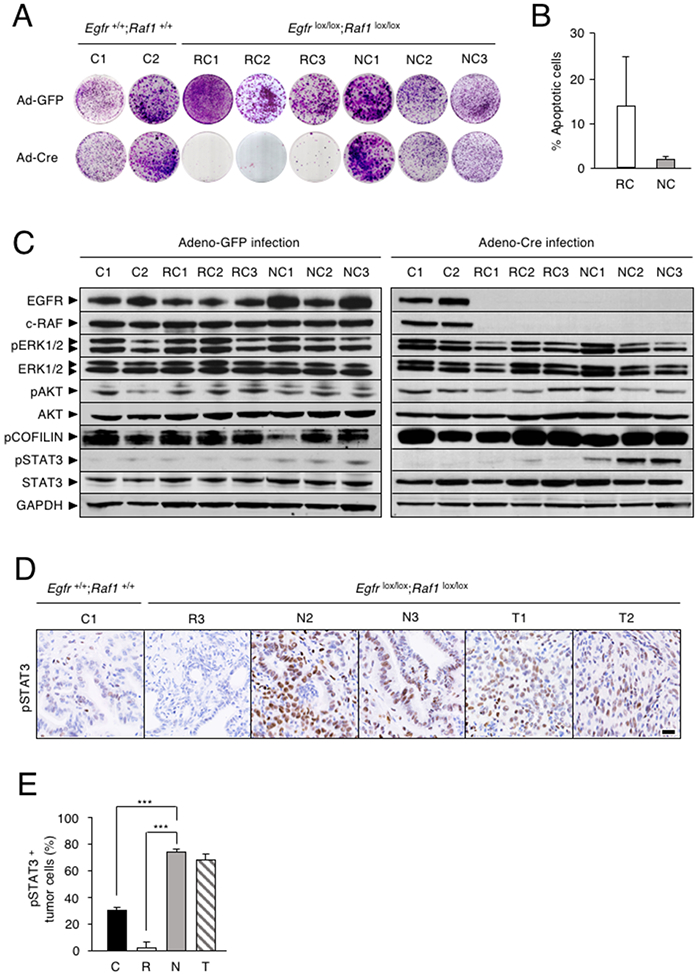
(A) Colony formation assay of tumor cell lines established from individual PDACs of two KPeFC;Egfr+/+;Raf1+/+ control mice (C1 and C2) and of six KPeFC;Egfrlox/lox;Raf1lox/lox animals, 3 “Regressor cells” (RC1-RC3) and 3 “Non responder” cells (NC1-NC3).
(B) Percentage of apoptotic cells (subG1 phase) at 96 hr after AdCre infection in (open bar) RC and (gray bar) NC cell lines (n=3). Error bars indicate mean ± SD.
(C) Western blot analysis of EGFR, c-RAF, pERK1/2, ERK1/2, pAKT, AKT, pCOFILIN, pSTAT3 and STAT3 protein expression in whole cell extracts of the indicated cell lines obtained 5 days after AdGFP or AdCre infection. GAPDH served as a loading control.
(D) pSTAT3 IHC in PDAC sections of KPeFC;Egfr+/+;Raf1+/+ (C1) mouse and KPeFC;Egfrlox/lox;Raf1lox/lox mice that harbored tumors that regressed (R3), progressed (N1, N3) or relapsed (T1, T2) upon Egfr and Raf1 ablation. Scale bar represents 20 μm.
(E) Quantification of pSTAT3 positive tumor cells in PDAC sections from control KPeFC;Egfr+/+;Raf1+/+ (C, solid bar, n=3), “Regressor” KPeFC;Egfrlox/lox;Raf1lox/lox (R, open bar, n=3). “Non Responder” KPeFC;Egfrlox/lox;Raf1lox/lox (N, grey bar, n=3) and “Resistant” KPeFC;Egfrlox/lox;Raf1lox/lox (T, striped bar, n=2) mice. Error bars indicate standard deviation. p values were calculated using the unpaired Student’s t test. ***p < 0.001.