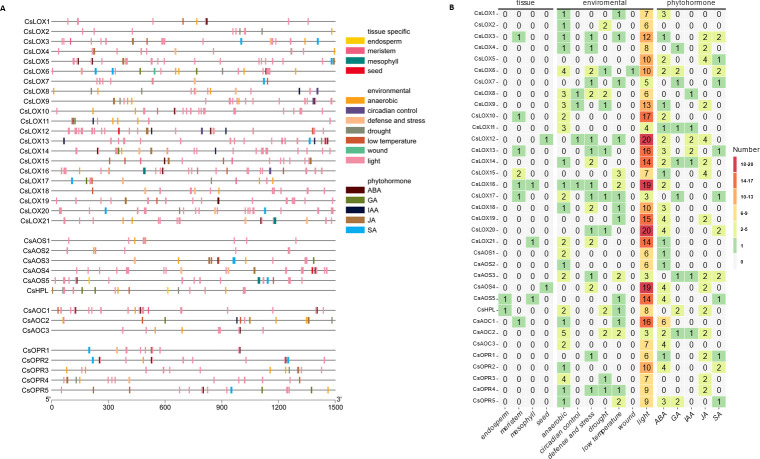
Fig 7. Cis-acting regulatory element distribution across C. sativa oxylipin biosynthetic gene promoters.
(A) Physical distribution of motifs throughout a 1.5 kb region upstream of corresponding gene model. Gene symbols are presented on the left with grey line representing promoter regions with motif positions. Legend describes motifs associate with tissue-specific expression, environmental responses, and phytohormone inducibility. (B) Summary of cis-acting regulatory motif content. Heatmap depicts number of motifs identified in gene promoter region. The y-axis depicts C. sativa oxylipin biosynthetic genes and x-axis depicts associated condition for motif. Cell values are number of motifs identified and are colored according to legend.

