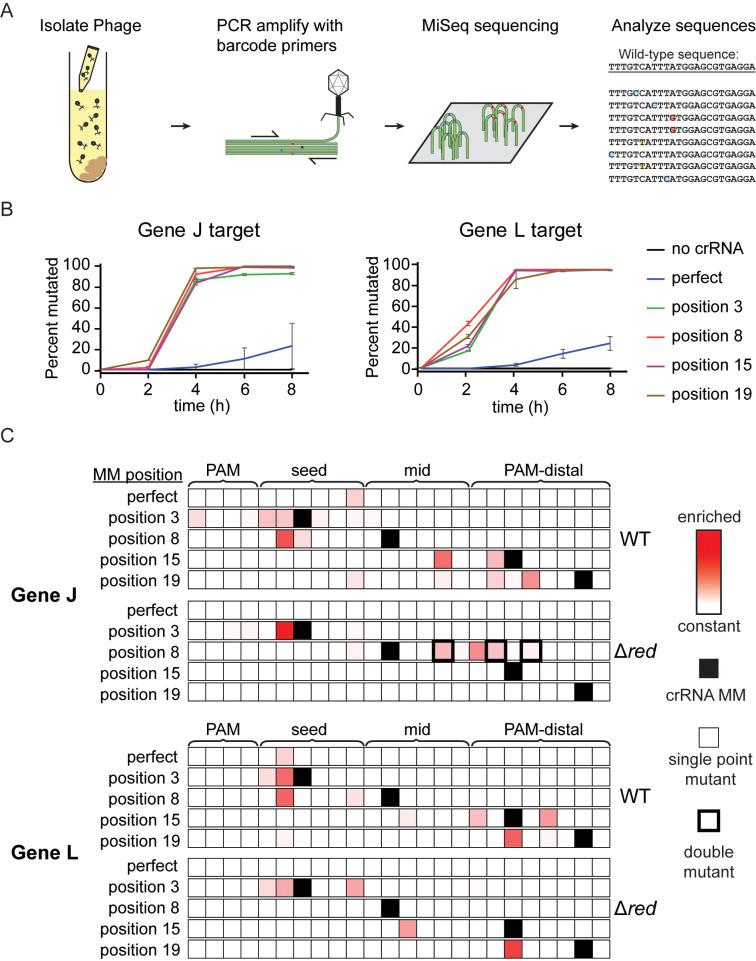
Fig 2. crRNA mismatches cause emergence of diverse lambda phage mutations.
(A) Schematic of workflow for determining the genetic diversity of phage exposed to interference by Cas12a. Phage samples were collected from liquid cultures at various time points and the target region was PCR amplified. Mutations were observed using MiSeq high-throughput sequencing of these amplicons. (B) Line graph tracking the fraction of phage with mutated target sequences over time. Samples were taken from liquid cultures at time points after phage infection. The “0 h” samples were taken directly after addition of phage to the culture tubes. The average of 2 replicates are plotted with error bars representing standard deviation. See S3 Data for quantified data. (C) Heat maps showing the location of enriched phage mutations in target regions at the 8 h time point for gene J or L targets. Z-scores for abundance of single-nucleotide variants, including nucleotide identity changes or deletions, were determined for each sample relative to the non-targeted control phage population. Experiments were performed using λvir phage (WT) and λvir phage with the red operon deleted (Δred). Enriched sequences indicate high Z-scores. Z-scores range from 0 (white) to 10.3 (darkest red). Single-nucleotide deletions are shown at adjacent position to the 3′ side. Positions with crRNA mismatches are labeled with solid black boxes in the heat map. A thin outline indicates that the majority of sequences contain single point mutations at these positions while a thick outline indicates that the majority of sequences contain multiple point mutations at these positions. See S3 Data for quantification of variant abundance.

