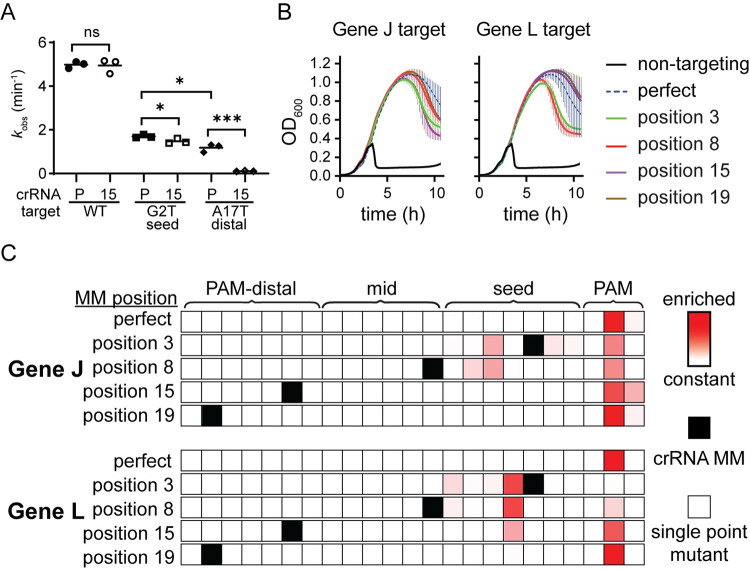
Fig 4. Cas9 challenge does not cause emergence of PAM-distal mutants.
(A) Observed rate constants for cleavage of a target plasmid bearing a wild type (WT), seed mutant (G2T) and PAM-distal mutant (A17T) gene L target sequence. Cas9 cleavage was measured for both the perfectly matched crRNA (P) or the MM15 crRNA (15). Significance was tested pairwise for all crRNA/target combination by unpaired two-tailed t test. * P ≤ 0.05, *** P ≤ 0.001, ns P > 0.05. Pairwise comparisons for which P value are not indicated had a P < 0.0001. See S9 Fig and S1 Data for crRNA and target sequences, gels, and quantified and fit data. (B) Growth curves of E. coli expressing Cas9 and sgRNAs bearing either a non-targeting sequence, the perfectly matching spacer sequence (perfect), or a spacer containing mismatch at the indicated position with respect to the PAM. Phage was added when the cells reached mid log phase at approximately 2 h after inoculation. The average of 3 replicates is plotted for each condition, with error bars representing standard deviation. See S2 Data for quantified data. (C) Heat maps showing the location of enriched phage mutations in target regions at the 8 h time point for gene J or L targets after Cas9-mediated selection. Z-scores for abundance of single-nucleotide variants, including nucleotide identity changes or deletions, were determined for each sample relative to the non-targeted control phage population. Enriched sequences indicate high Z-scores. Z-scores range from 0 (white) to 7.0 (darkest red). See S7 Data for quantification of variant abundance.

