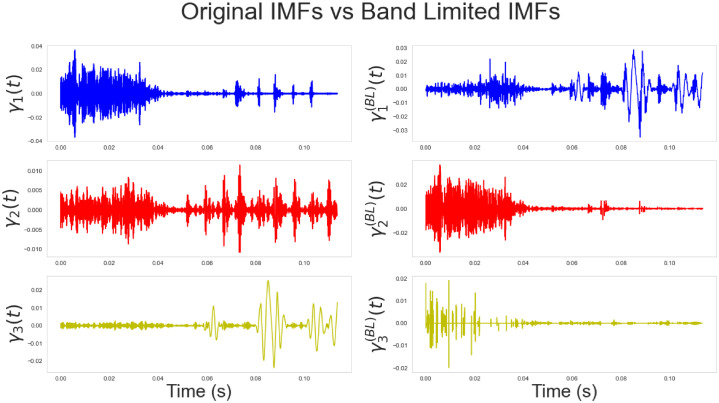
Fig 5. Comparison of the original extracted IMFs (left panels) and the obtained band-limited IMFs.
(right panels). The original signal is a segment of the speech signals considered in section 7. The x-axis represents time and is given in seconds. It corresponds to 0.13 seconds, or, 130 milliseconds approximately (given that the speech segments is 5000 samples recorded at 44.kHz). The y-axis shows the amplitudes of the IMFs (left panels) and the band-limited IMFs (right panels).

