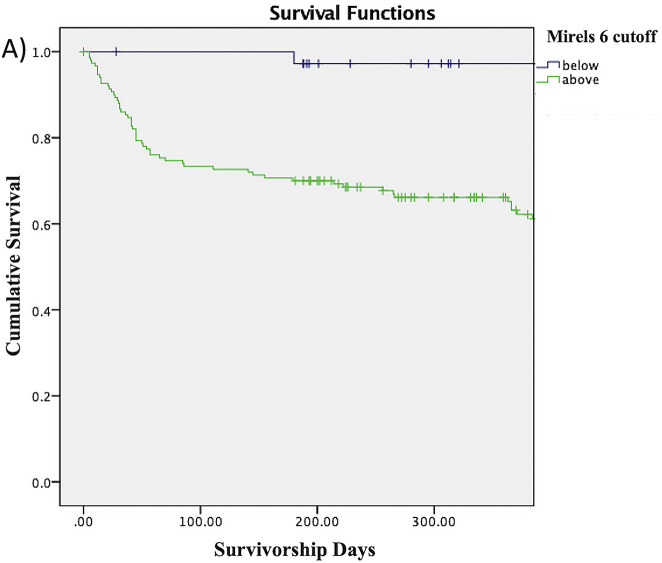
Fig. 2-A.
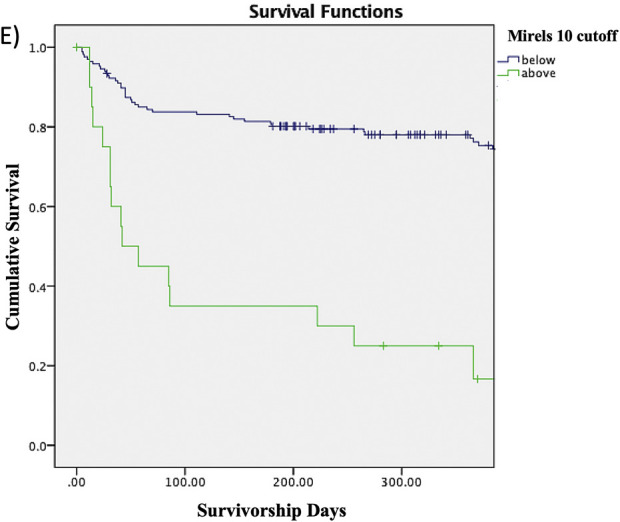
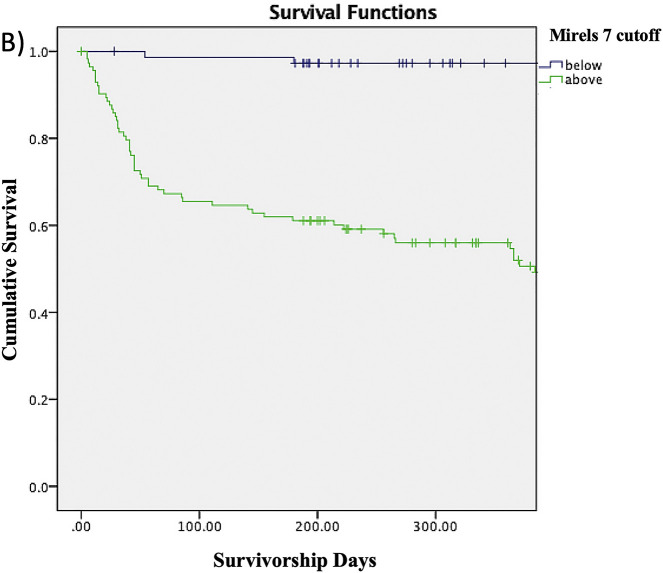
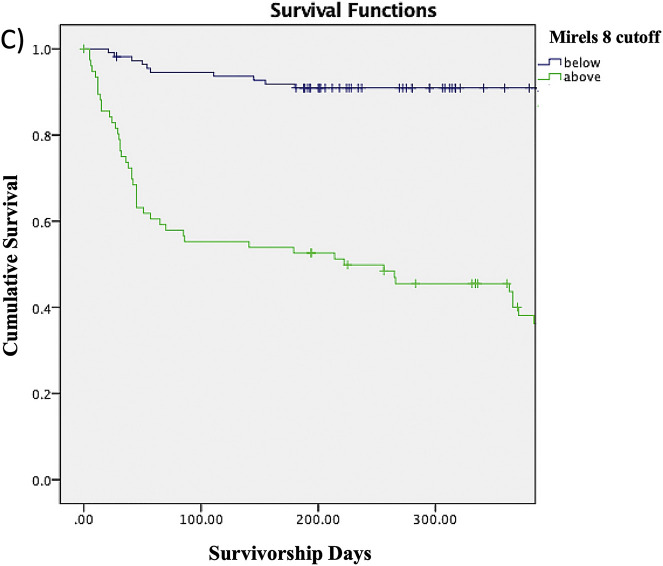
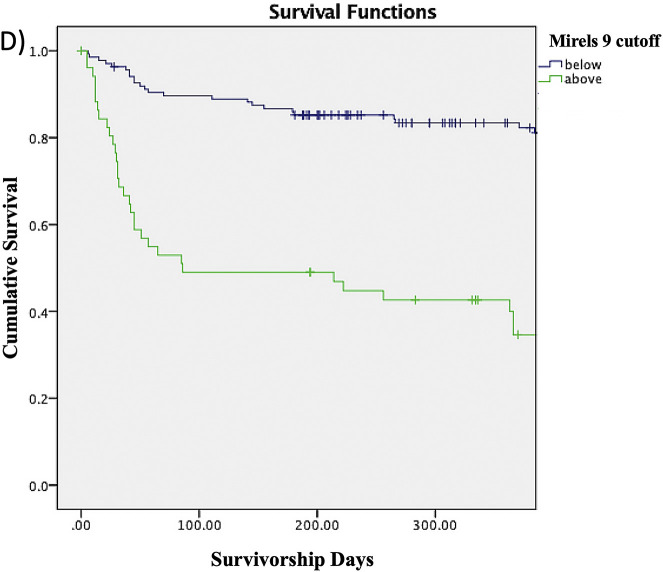
Figs. 2-A through 2-E Kaplan-Meier survivorship curves for Mirels scores of ≥6 (Fig. 2-A), ≥7 (Fig. 2-B), ≥8 (Fig. 2-C), ≥9 (Fig. 2-D), and 10 (Fig. 2-E). The blue line represents patients who have a Mirels score less than the cutoff, and the green line represents patients with a Mirels score greater than or equal to the cutoff. Each line shows the proportion of patients who have not developed a pathological fracture at the given time interval. The log-rank test indicated that there was a significant difference (p < 0.01) between the 2 curves for each cutoff.
Fig. 2-A.
Fig. 2-B.
Fig. 2-C.
Fig. 2-D.
Fig. 2-E.
