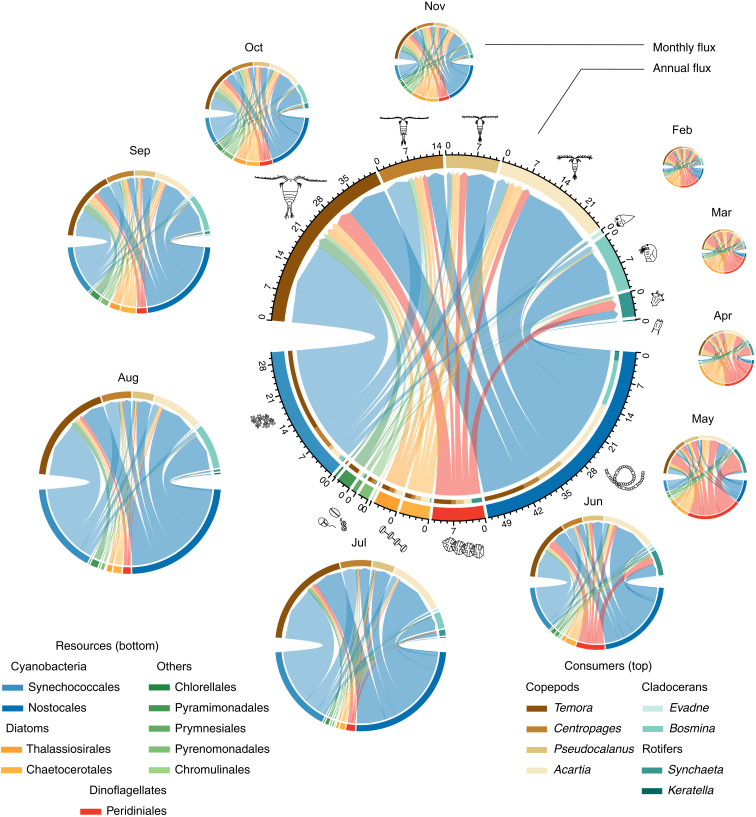
Fig. 2. Consumer-resource network of the pelagic Baltic Sea.
Link width is proportional to fluxes of energy (kJ/m2) between resources (phytoplankton, bottom) and consumers (zooplankton, top). The width of the nodes (taxa) corresponds to each population’s contribution to annual secondary production. The diameter of each plot is proportional to the square root of the total production.

