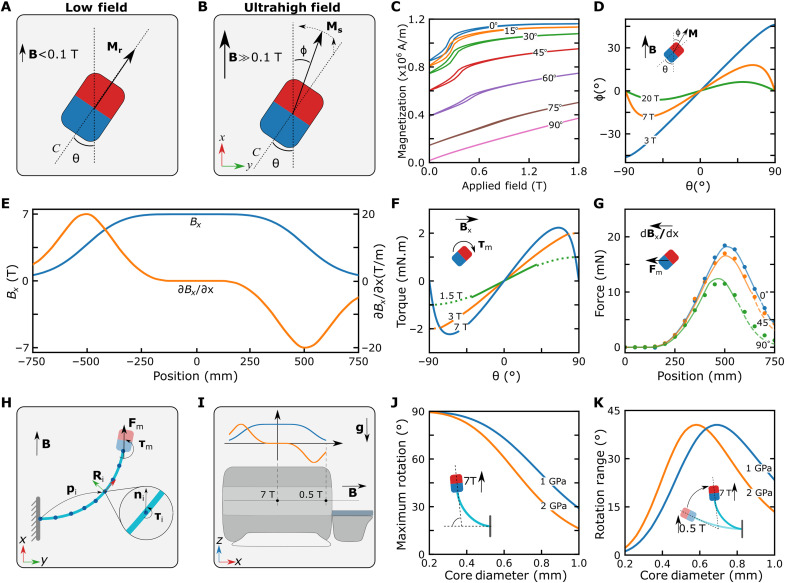
Fig. 2. Magnetic actuation method at UHF.
(A) Magnetization at low fields, B < 0.1 T. The red and blue colors represent the direction of the easy axis (C). (B) Magnetization at high fields, B >> 0.1 T. The permanent magnet is magnetized substantially by the external magnetic field. (C) Magnetization curves of the cylindrical neodymium magnet measured inside a vibrating sample magnetometer at different θ. The magnet’s magnetization in the x direction is measured, while the magnetic field is swept from 0 to 1.8 T in the x direction. (D) Magnetization vector alignment as a function of the easy axis alignment at different external field strengths. (E) Magnetic fields and gradients in the x direction of the MRI scanner. (F) Model-based magnetic torque acting on the cylindrical magnet as a function of the magnet orientation. The magnet is in its saturation regime for the solid lines and nonsaturated regime for the dashed lines. The direction of the torque is shown on the schematic. (G) Magnetic force as a function of the magnet position in the MRI scanner for different magnet orientations. The solid lines represent the force estimated with the magnetization model using the MRI magnetic field and gradient measurements. The dashed lines are the linear model estimation in the nonsaturated region. The dots are the force sensor measurements in the experiments. (H) The discretized Cosserat rod model, including the magnetic actuation. (I) Schematic of the magnetic actuation simulations. (J and K) The maximum rotation and rotation range in the simulations as a function of the guidewire thickness.

