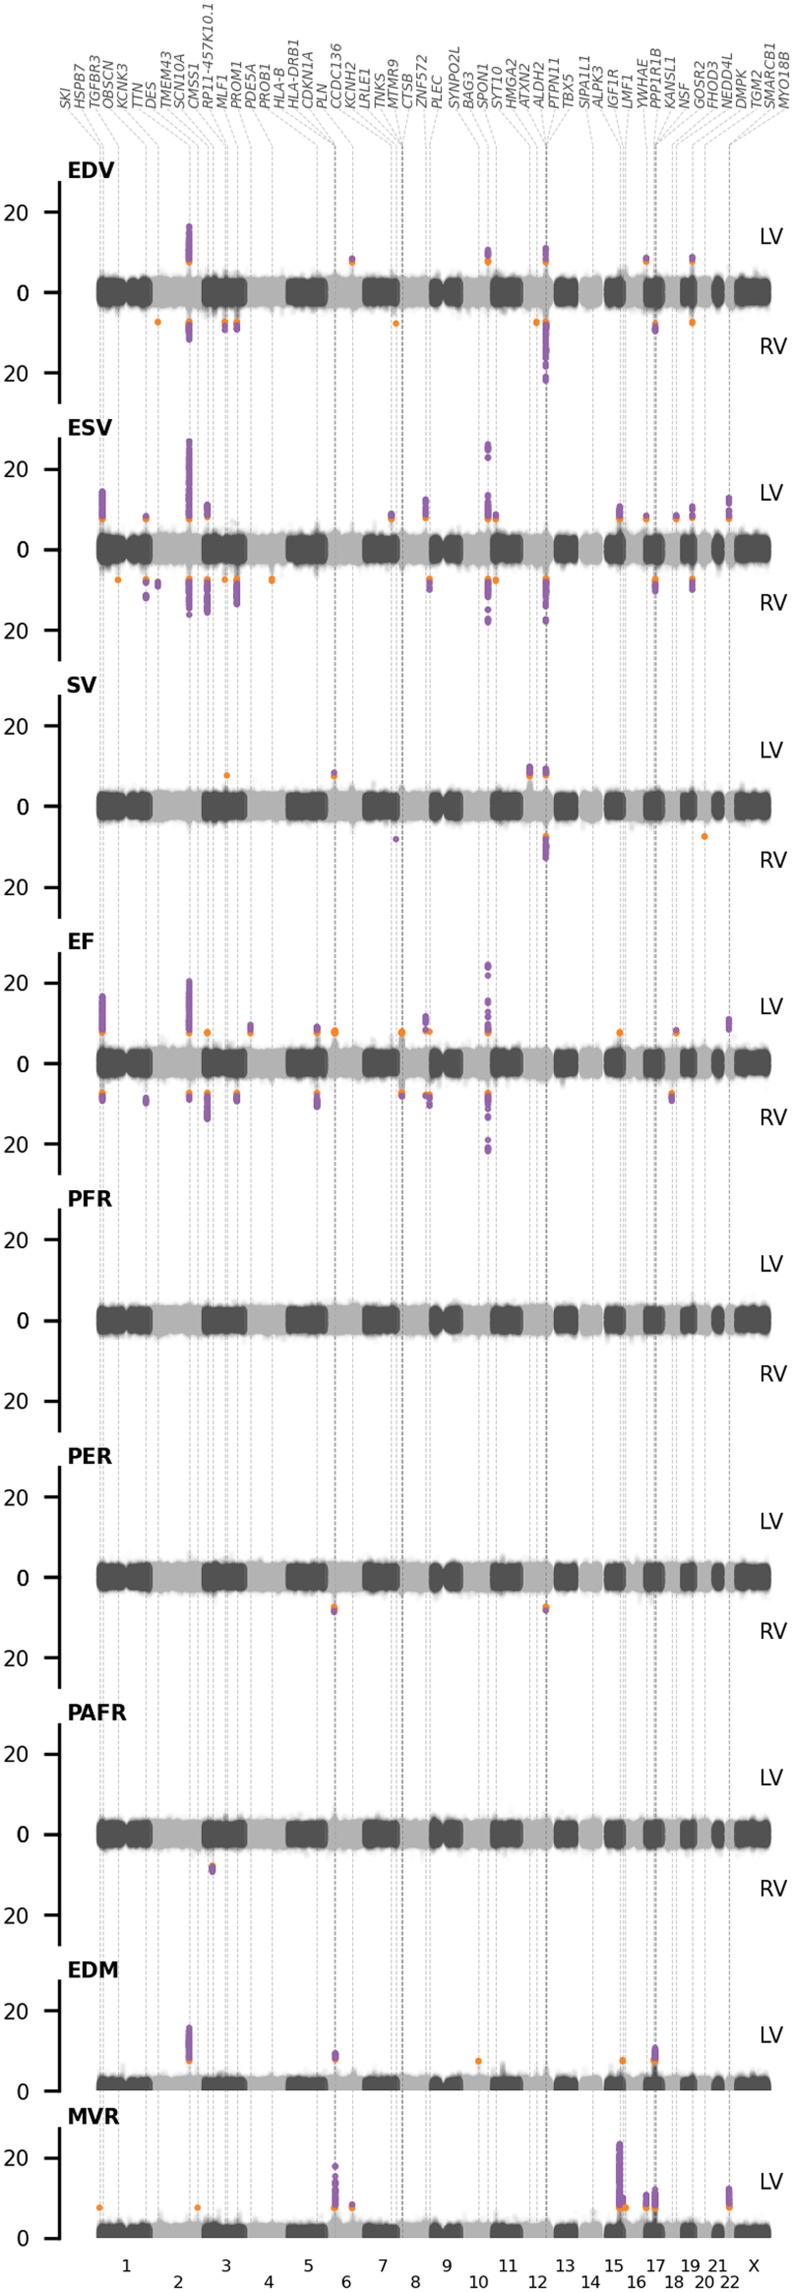
Fig. 2. Manhattan plots of genome-wide CMR associations with genomic annotations.
Purple dots indicate associations that pass the conservative significant threshold of 7.14 × 10⁻⁹, with orange dots associating between 5.00 × 10⁻⁸ and 7.14 × 10⁻⁹; labels indicate the lead gene in the region. CMR, cardiac MRI; LV, left ventricle; RV, right ventricle; EDV, end-diastolic volume; ESV, end-systolic volume; SV, stroke volume; EF, ejection fraction; PER, peak ejection rate; PAFR/PFR, peak (atrial) filling rate; EDM, end-diastolic mass; MVR, ratio between end diastolic mass and volume. Results are based on an analysis of up to 36,548 subjects.

