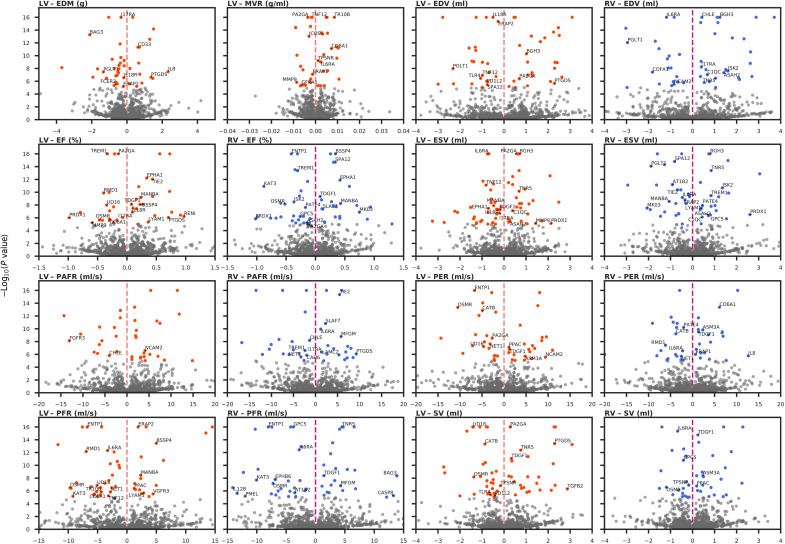
Fig. 3. Volcano plots of the plasma protein effect on CMR traits.
Proteins were annotated if they were part of the drugged, druggable, directionally concordant, or nearest druggable protein sets. Results were colored by LV and RV if they passed a P value threshold of 7.81 × 10⁻⁶. The MR effects per unit (in SD) change in the protein are plotted on the x axis, against the −log10(P value) on the y axis. Nomenclature: Proteins are referred to by their UniProt entry name to differentiate them from the encoding genes.

