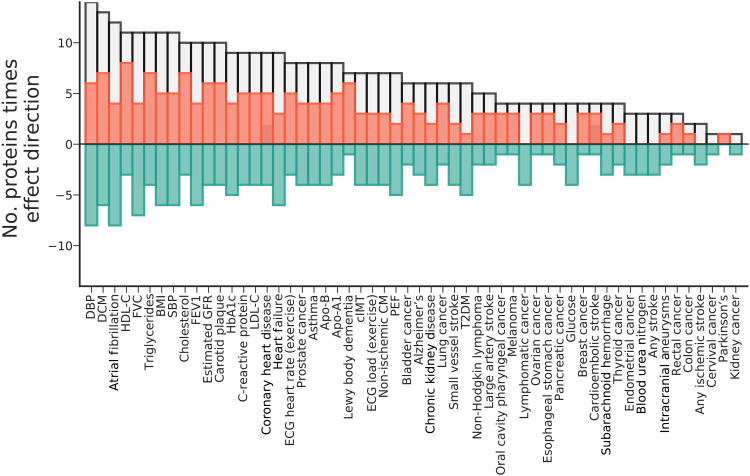
Fig. 7. The frequency of a prioritized plasma protein affected the depicted trait.
The absolute frequencies (i.e., counts) of associations areprovided as a gray bars, reflecting the number MR estimates that passed a multiplicity-corrected P value threshold of 7.81 × 10⁻⁶. The effect direction of these associations is depicted in orange (counting the number of positive associations) or green (counting the number of negative associations), which sum to the absolute frequency. Plasma proteins were prioritized (Fig. 4) for involvement with CMR traits and cardiac outcomes (AF, CHD, HF, DCM, and non-ischemic CM). Note that the individual protein-trait associations are presented in fig. S15 and a subset in Fig. 6.

