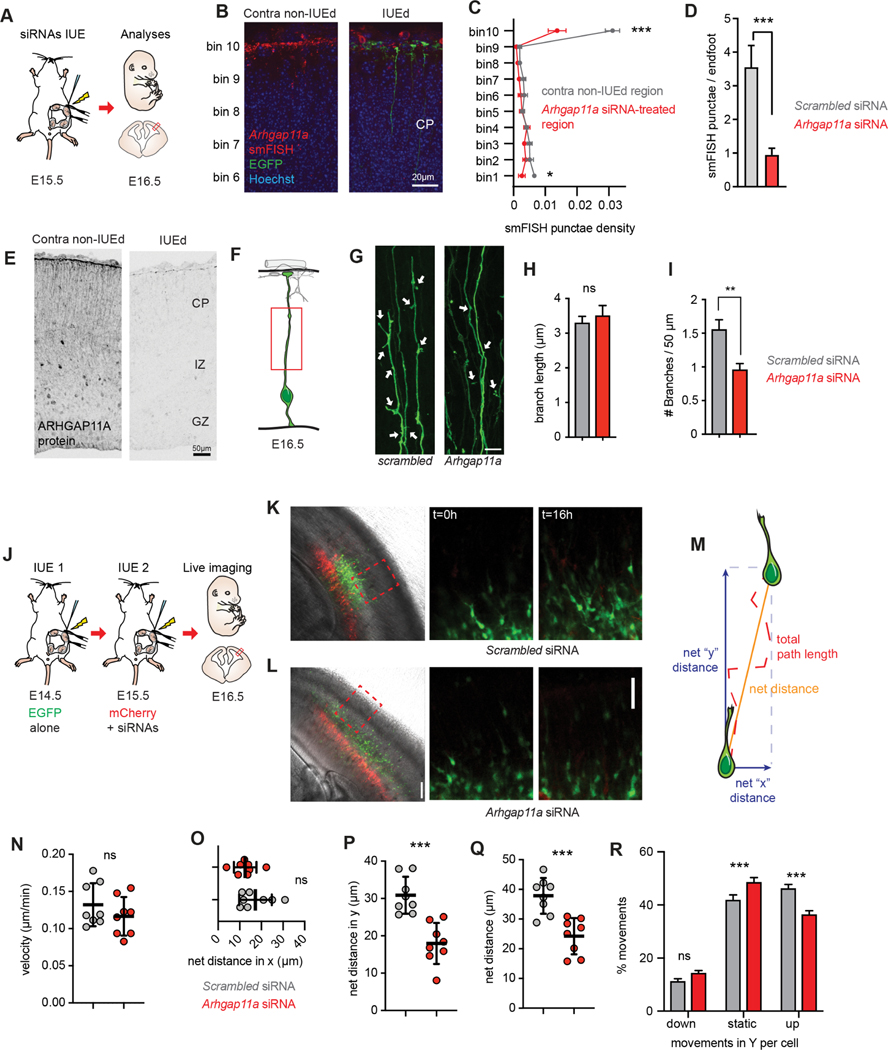
Figure 2. Arhgap11a controls RGC basal process morphology and non-cell autonomously controls radial migration of excitatory neurons.
(A) Schematic overview of the experiments in (B-I).
(B-E) Arhgap11a mRNA is depleted from endfeet in the Arhgap11a siRNA electroporated region (IUE, green), evidenced by smFISH (red) (B) and immunofluorescence (E). (C) Binned quantification of Arhgap11a smFISH punctae in electroporated and contralateral non-electroporated regions. Bin 1 is apical lining the ventricle, and Bin 10 is adjacent to the meninges.
(D) Quantification of Arhgap11a smFISH punctae in electroporated RGC endfeet.
(F) Cartoon of regions analyzed in RGC basal processes.
(G) EGFP electroporated RGCs depicting reduced branches (arrows) along the basal process following Arhgap11a knockdown.
(H) Quantification of the length of branches along the RGC basal process. (Scrambled: n=101 branches, 3 brains, 3 independent experiments; Arhgap11a: n=72 branches, 3 brains, 3 independent experiments, unpaired t-test with Welch’s correction)
(I) Quantification of the density of branches along the RGC basal process. (Scrambled: n=112 cells, 6 brains, 5 independent experiments, Arhgap11a: n=99 cells, 5 brains, 4 independent experiments, unpaired t-test with Welch’s correction)
(J) Schematic overview of the experiments in (J-R) aimed at testing the impact of Arhgap11a depletion in RGCs on neuronal migration. Sequential IUEs were performed to label neurons (EGFP, green) and RGCs (red) at E16.5 when analysis is performed.
(K,L) Representative images showing electroporated regions (left) and position of migrating of neurons (green) at the beginning (t=0 hrs, middle) and end of the live-imaging experiment (t=16 hrs, right).
(M) Neuronal migration parameters analyzed.
(N-R) Quantification of velocity of neuronal migration (N), net-distance in X trajectory (O), net distance travelled in Y trajectory (P) and compiled distance (Q). (R) Arhgap11a knockdown in RGCs non-cell autonomously causes neurons to undergo more static movements and fewer movements toward the cortical plate (up). (Scrambled and Arhgap11a: n=8 brains, 2 independent experiments, unpaired t-tests)
siRNAs: small interfering RNAs, IUE: in utero electroporation, CP: cortical plate, IZ: intermediate zone. *: p-value<0.05. **: p-value<0.01. ***: p-value<0.001. Scale bars: B: 20 μm, D,J-K right panels 50 μm, F: 10 μm, J-K left panels: 100 μm. Bar plots, means +/− SE.

