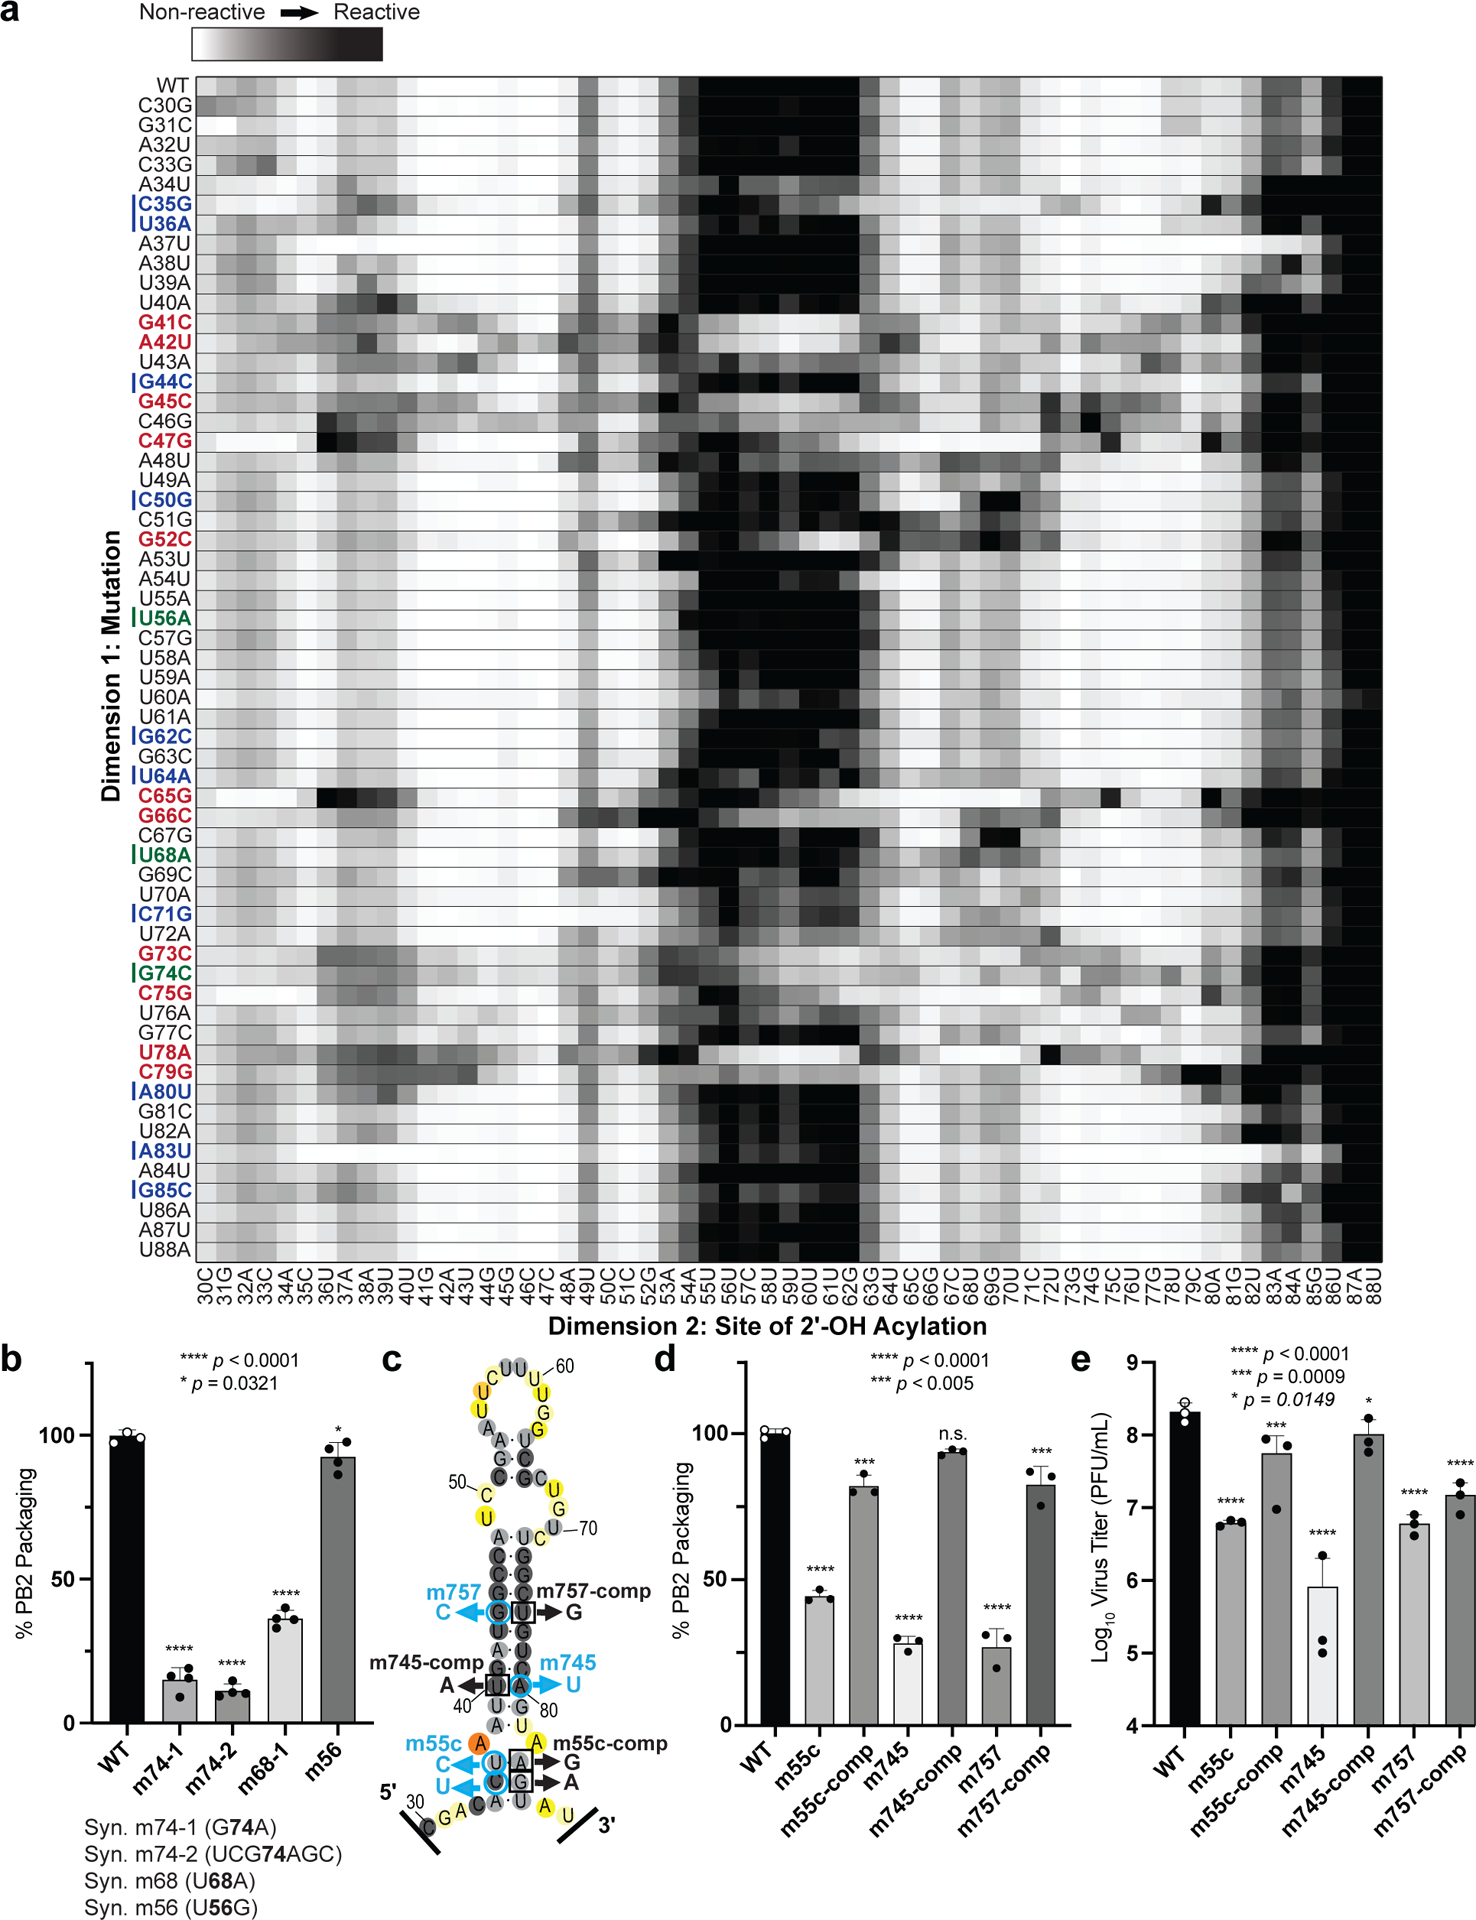
Figure 2. 2-Dimensional Mutate-and-Map (M2) analysis and empiric validation of PSL2 motif.

(a) Systematic single nucleotide mutation and mapping of resulting chemical accessibility reveals interactions in the three-dimensional structure of the RNA. Chemical accessibilities, plotted in grayscale (black, highest SHAPE reactivity), across 59 single mutations at single-nucleotide resolutions of PSL2 element from PR8 strain segment PB2. Reactivity peaks (left to right) correspond to nucleotides from the 5′ to 3′ end of the PB2 RNA. Nucleotides corresponding to known packaging mutation sites11 are indicated on left in blue. Red bolded mutations denote packaging-defective mutant sites predicted by M2 analysis. Green bolded mutations indicate synonymous mutant sites analyzed in (b). (b) Packaging efficiencies of M2-identified synonymous mutants read out by RT-qPCR. Packaging efficiency represents the percentage of mutant PB2 vRNA packaging relative to parental wild-type PB2. Results from two independent experiments in biological duplicate and technical triplicate (n=4). **** p < 0.0001, * p = 0.0321. (c) Previously described synonymous mutants (m757, m745, m55c) are mapped onto PSL2 structure. Compensatory, non-synonymous mutations m55c-comp, m745-comp, and m757-comp were designed at sites predicted to restore wild-type PSL2 structure based on SHAPE and mutate-and-map chemical analyses. Black boxed nucleotides denote compensatory mutation sites. (−)-sense vRNA orientation is shown. (d) Packaging efficiencies of packaging-defective and compensatory mutant viruses. For compensatory mutations where a non-synonymous change was required, a wild-type PB2 protein expression plasmid was co-transfected during virus rescue. Values given as percentage of PB2 vRNA packaging relative to wild-type PR8 virus. Results from three independent experiments (n=3), assays performed in triplicate. **** p < 0.0001, *** p < 0.0005, n.s. = not significant. (e) Virus titer determined by plaque assay. Results in PFU / mL, plaque assays in triplicate (n=3). **** p < 0.0001, *** p = 0.0009, ** p = 0.0149. All error bars represent mean ± s.d. All statistical analysis were performed by ordinary one-way ANOVA using Dunnett’s multiple comparisons test against WT computed in GraphPad Prism 9 software.
