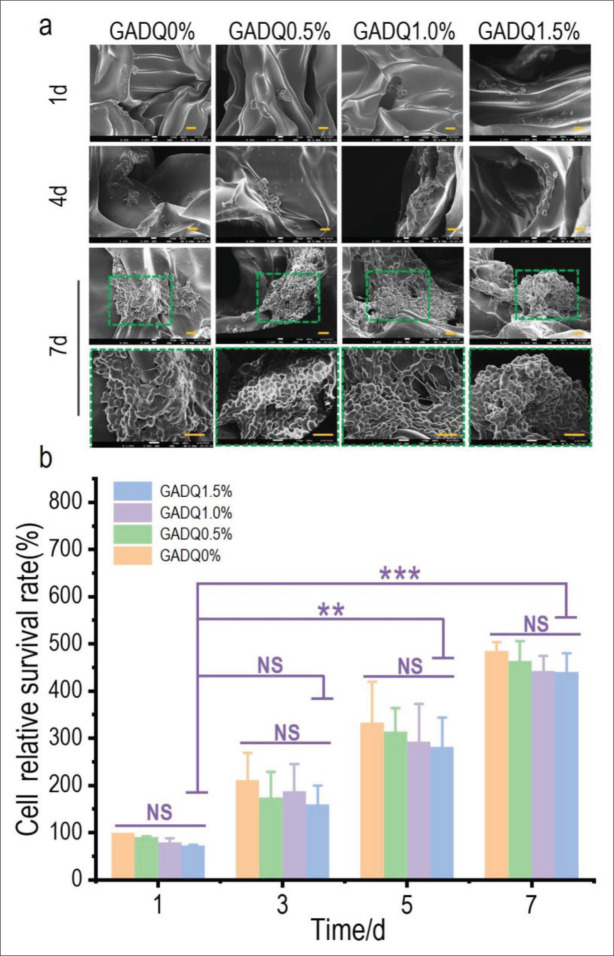
Figure 8.
The morphological observation of L929 fibroblasts on the hydrogels by SEM and cytotoxicity test of the hydrogels. (a) The SEM images of fibroblasts cultured on the hydrogels for 1, 4, and 7 days (500× magnification, scale bar: 20 μm) and the enlarged images of fibroblasts for 7 days (1000× magnification, scale bar: 20 μm). (b) Cell survival ratio on the hydrogels tested by CCK-8. Data are expressed as mean ± SD. NS: p > 0.05; * p < 0.05, ** p < 0.01, *** p < 0.001.

