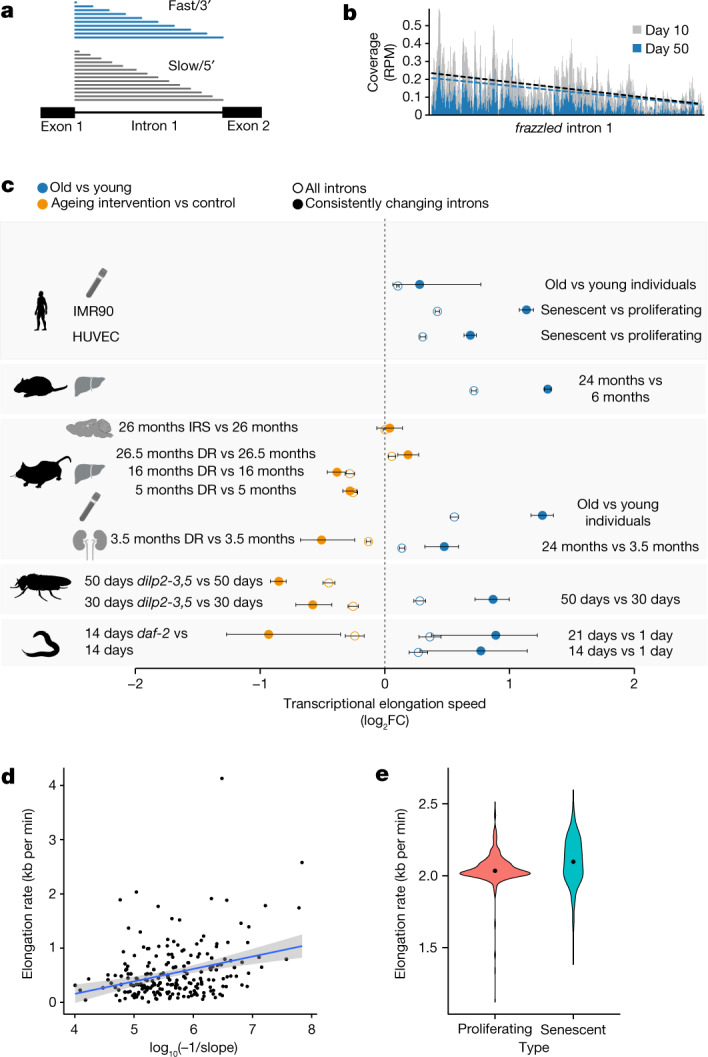
Fig. 1. Pol II elongation speed increases with age and is slowed down by reduced insulin signalling and dietary restriction in multiple species.

a, Schematic representation of read coverage along introns in total RNA-seq. Intronic reads represent transcriptional production at a given point in time. A shallower slope of the read distribution is a consequence of increased Pol II elongation speed. b, Exemplary read distribution in intron 1 of frazzled, with coverage in reads per million (RPM) for D. melanogaster at age day 10 and day 50. Black dashed line, slope at day 10; blue dashed line, slope at day 50. c, Log2 fold change (FC) of average Pol II elongation speeds in the worm (whole body), fruitfly (brains), mouse (the kidney, liver, hypothalamus and blood), rat (liver), human blood, and HUVECs and IMR90 cells. Error bars show median variation ± 95% CI (two-sided paired Wilcoxon test). Empty circles indicate results using all introns passing the initial filter criteria, whereas solid circles show results for introns with consistent effects across replicates. The number of introns considered (n) ranged from 518 to 6,969 (see Supplementary Table 3 for details). DR, dietary restriction; IRS, inhibition of insulin–IGF signalling. Dashed line at 0 indicates no change as a visual aid. d, Estimate of transcriptional elongation speed from 4sUDRB-seq in IMR90 cells versus intronic slopes for 217 genes for which elongation speed could be estimated using both assays. Each dot represents one gene (Pearson correlation = 0.313, P = 2.5 × 10⁻⁶). The grey band shows the 95% CI for predictions from the linear model of elongation rate~log10(−1/slope). e, Distribution of elongation speeds in IMR90 cells based on 4sUDRB-seq. The black dot indicates the average speed. The difference between speeds is statistically significant (two-sided paired Wilcoxon test, P = 2.13 × 10⁻¹⁰). The same genes (464 genes) were used for both conditions (see Methods for details). In panel c, the silhouettes of the organs were created using BioRender (https://biorender.com), and the silhouettes of species are from PhyloPic (https://phylopic.org).
