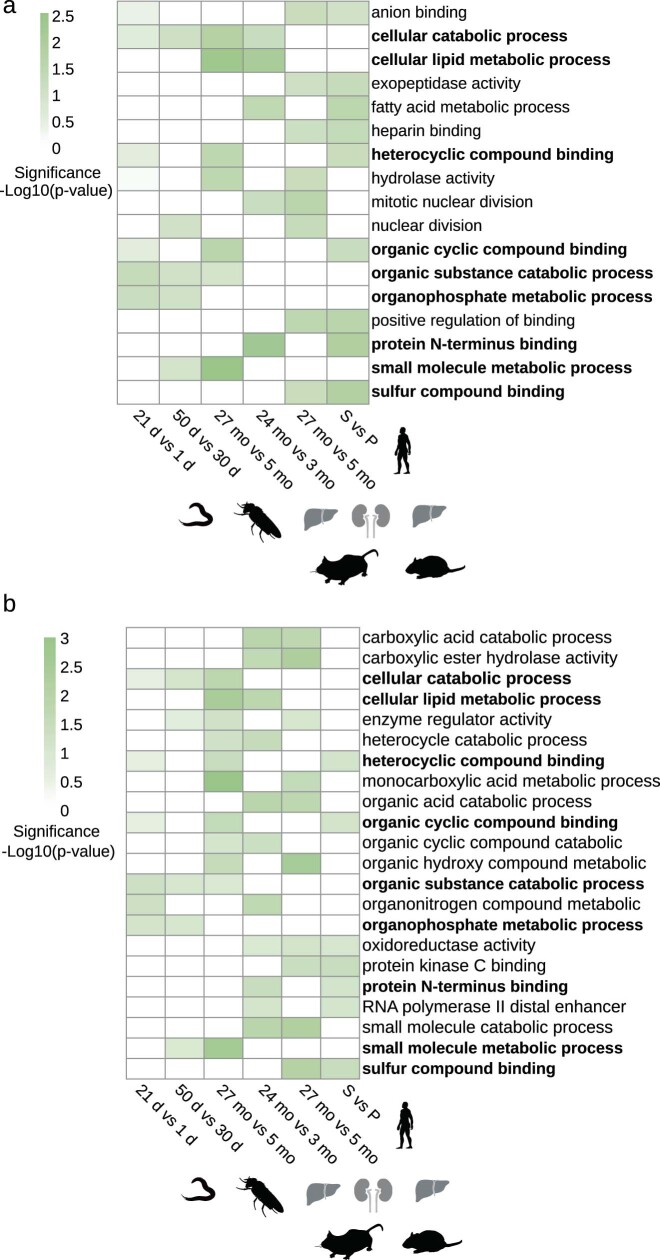
Extended Data Fig. 5. Genes with increase in Pol-II speed are associated with metabolism and catabolism related pathways.
GO enrichment analysis of genes with increased Pol-II speed across species: C. elegans (21 d vs 1 d), D. melanogaster (heads: 50 d vs 30 d), M. musculus (kidney: 24 mo vs 3 mo), R. norvegicus (liver: 24 mo vs 6 mo), H. sapiens (IMR90: Senescent vs Proliferating). GO enrichment of (a), top 200 (b), top 300 genes with an increase in Pol-II speed change for each species (common terms between the two sets in bold). Color scale indicates the significance of the enrichment (all GO terms enriched with p-values below 0.05, with at least 10 significant genes for each GO categories, Fisher elim test). In all panels, the silhouettes of the organs were created using BioRender (https://biorender.com), and the silhouettes of species are from PhyloPic (https://phylopic.org).

