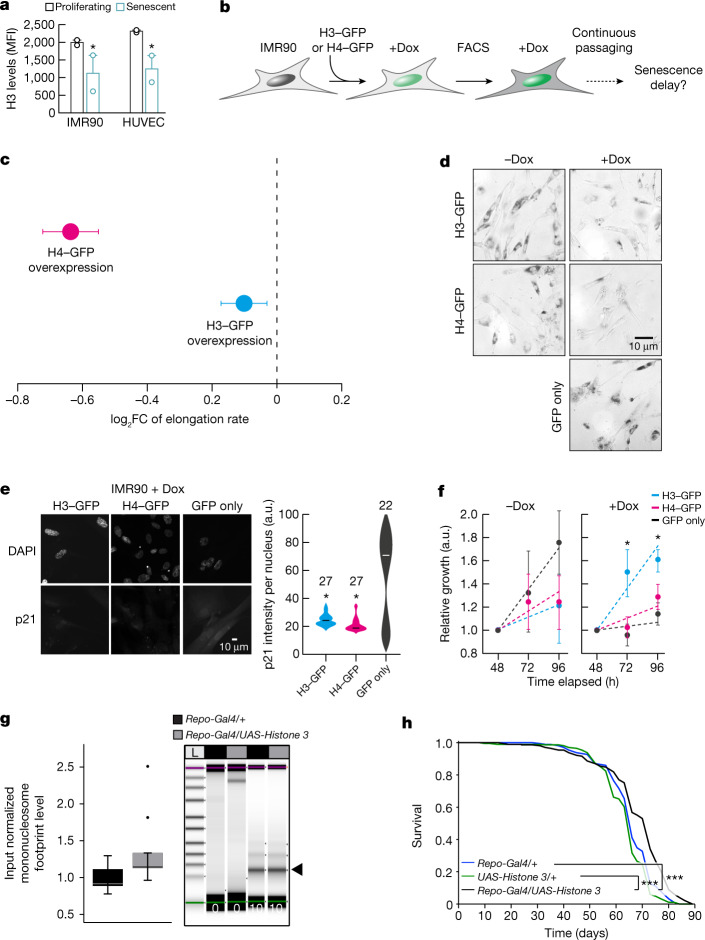
Fig. 5. Histone overexpression slows down entry into senescence and decreases Pol II speed.
a, Levels of H3 protein in proliferating and senescent HUVECs and IMR90 cells. Each data point comes from an independent biological replicate (different HUVEC donor or IMR90 isolate) and is the mean of three technical triplicates. H3 expression decreases with senescence (*P < 0.05, two-tailed Student’s t-test). MFI, mean fluorescence intensity. b, Schematic representation of the experiment. FACS, fluorescence-activated cell sorting. c, Differences of average Pol II elongation speeds between histone overexpression mutants and wild-type IMR90 cells (derived from 1,212 introns). Error bars show median variation ± 95% CI. All average changes of Pol II elongation speeds are significantly different from zero (P < 0.01; paired Wilcoxon rank test). Dashed line at 0 indicates no change as a visual aid. d, Typical images from β-galactosidase staining of H3–GFP, H4–GFP and control IMR90 cells, in the presence and absence of doxycycline (Dox). e, Typical immunofluorescence images of H3–GFP, H4–GFP and control IMR90 cells (left) show reduced levels of p21 in histone overexpression nuclei. Violin plots (right) quantify this reduction (*P < 0.05, two-tailed Student’s t-test). The number (n) of cells analysed per condition is indicated. f, MTT proliferation assay. For each H3–GFP or H4–GFP overexpression, mean ± s.d. were derived from two independent clones over three replicates for each clone. (*P < 0.05, two-tailed Student’s t-test). g, Quantification of input normalized mononucleosome footprints (black arrowhead) between the heads of aged (60 days) flies overexpressing Histone 3 in glial cells (Repo-Gal4/UAS-Histone 3) and control fly heads (Repo-Gal4/+). Significance was determined by paired two-tailed t-test (ten biologically independent replicates per fly group; *P = 0.0417). The upper and lower ‘hinges’ of the boxplot correspond to the first and third quartiles of the measurements. Digests were halted after 10 min and visualized by Tapestation (Agilent) (n > 5). The lines in each lane represent the internal upper (purple) and lower (green) markers, for sizing and alignment. L, DNA ladder. h, Lifespan analysis of Repo-Gal4/UAS-Histone 3 flies and control flies (Repo-Gal4/+ and UAS-Histone 3/+) (n = 200, ***P < 0.001).

