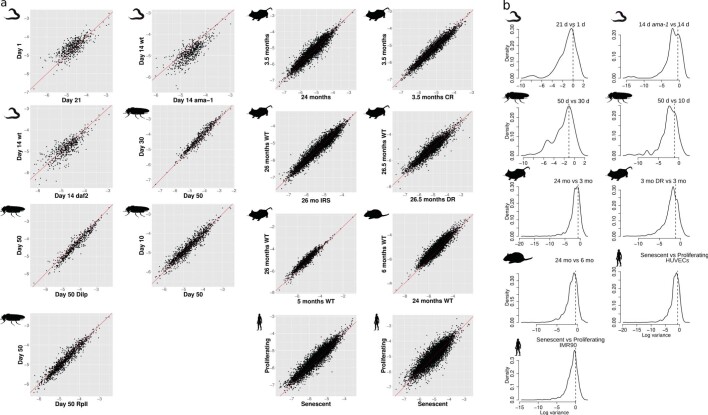
Extended Data Fig. 2. Consistency of Pol-II elongation speed estimates between samples and within genes.
(a) Scatterplots of intronic slope (−log10) for each condition and species (C. elegans, D. melanogaster, M.musculus, R. norvegicus, H. sapiens). (b) Variation of intronic slope (−log10) changes for different introns of the same gene. Distribution of variances of Pol-II speed estimates (slope per intron) for introns within the same gene. Average variance of speed estimates across all introns (i.e. between genes; global average) is shown as a dashed vertical line for C. elegans (21 d vs 1 d; 14 daf-2 d vs 14 d), D. melanogaster (heads 50 d vs 30 d; 50 d vs 10 d), M. musculus (kidney: 24 mo vs 3 mo; 3 DR mo vs 3 mo), R. norvegicus (liver: 24 mo vs 6 mo), H. sapiens (Umbilical vein endothelial (HUVECs); fibroblast fetal lung (IMR90): Senescent vs Proliferating). The vast majority of intra-gene variances are below the average inter-gene variance, suggesting that introns of the same gene have coupled Pol-II elongation speeds. In all panels, the silhouettes of species are from PhyloPic (https://phylopic.org).

