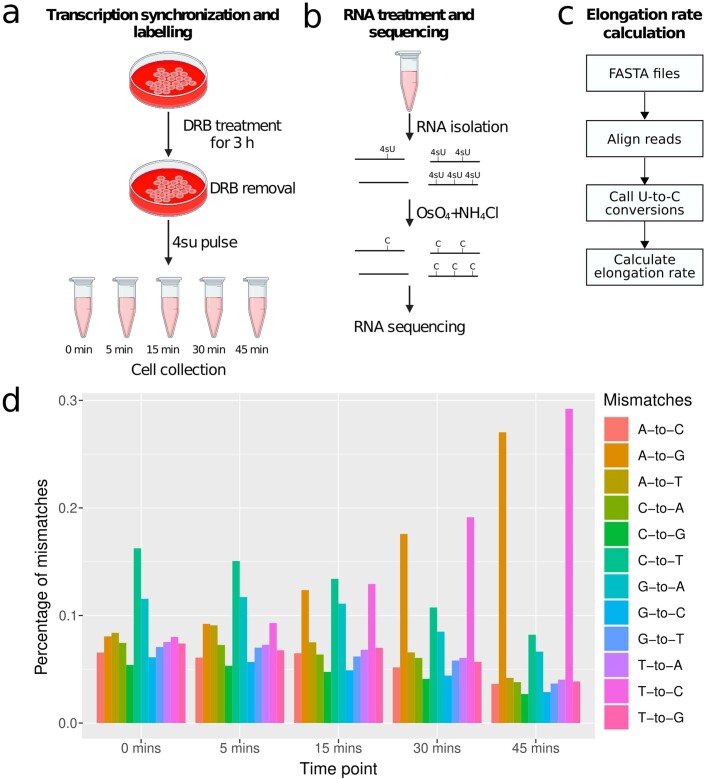
Extended Data Fig. 4. 4SU-DRB labelling and TUC conversion to calculate RNA-Pol-II elongation rate.
(a–c) Schematic representation of the 4SU-DRB labelling (a), TUC conversion (b) and elongation rate calculation (c). Cell culture and eppendorf icons created with BioRender.com. (d) Percentage of mismatches in every time point of the experiment (0 mins, 15 mins, 30 mins, 45 mins) in one of the proliferating replicates. There is a noticeable increase in A-to-G and T-to-C mismatches in the last two time points.

