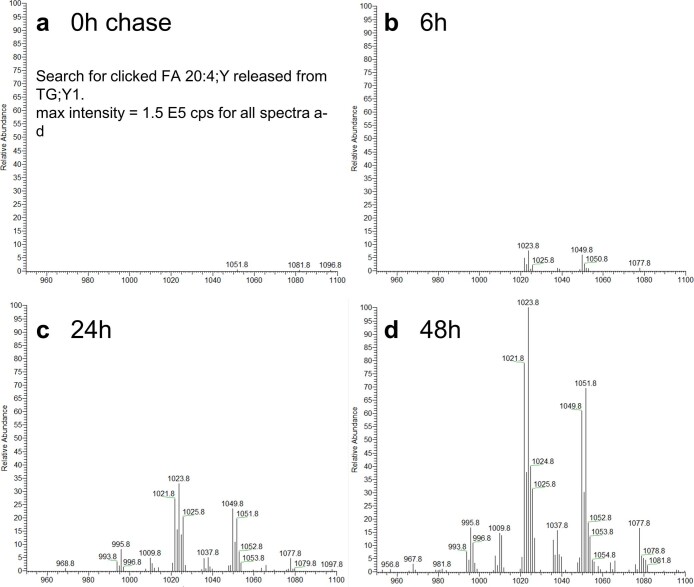
Extended Data Fig. 8. Time course of appearance of TG;Y1 containing FA 20:4;Y.
Raw MS2 spectra from samples of the pulse-chase experiment were searched for the fragment m/z 398.28, tolerance 0.01 Da, that is characteristic for the presence of FA 20:4;Y in TG;Y1. The panels show the resulting precursor ion spectra; all are plotted at the same scale for maximum intensity. Major species are: TG 52:6;Y at m/z 1021.8, TG 52:5;Y at m/z 1023.8, TG 54:6;Y at m/z 1049.8, TG 54:5;Y m/z 1051.8.

