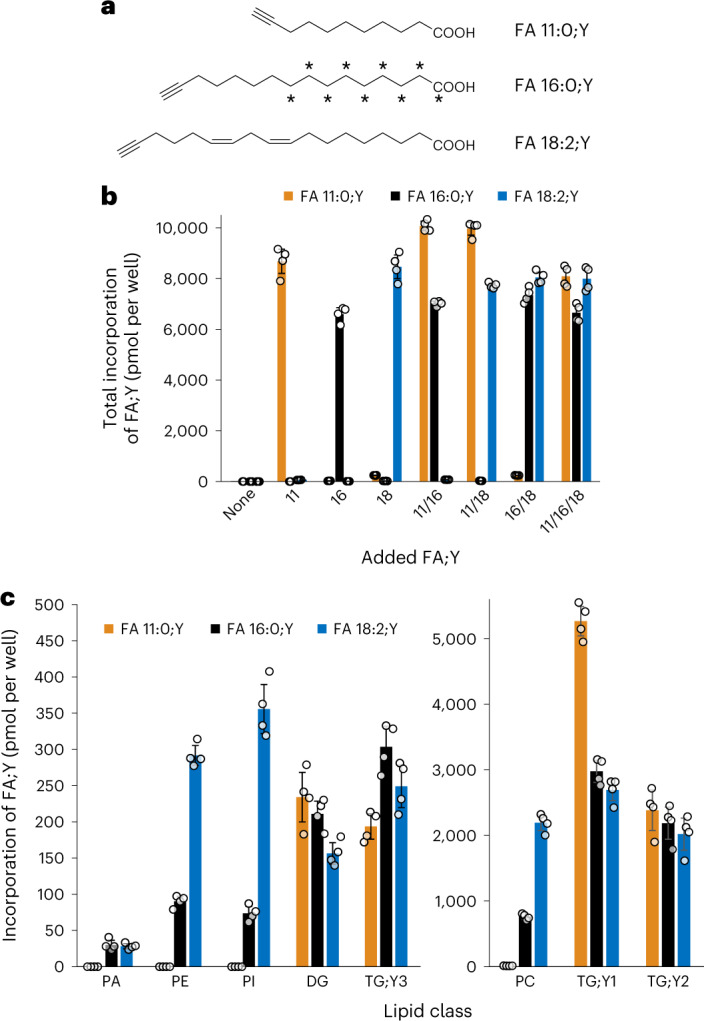
Fig. 2. Total incorporation and lipid class preferences of FA;Y in 3T3-L1 adipocytes.

a, Structures of the FA;Ys used for labelling. b, Incorporation of FA;Y per lipid class for three different input FA;Ys. Numbers are pmol per lipid class per well. c, Total incorporated FA;Y in major lipid classes upon labelling with the 11/16/18 combination as described in Fig. 1b. Numbers are pmol of respective FA;Y per well. All values are average ± s.d., n = 4.
