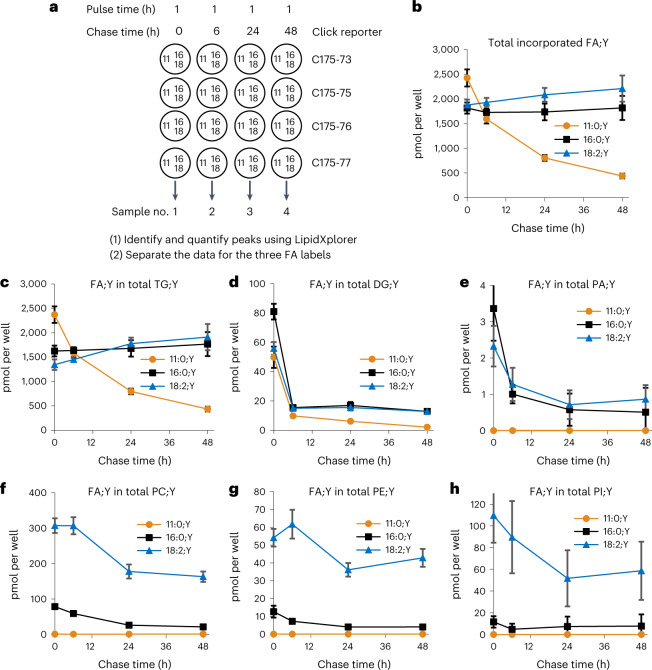
Fig. 3. Distribution over time of the three FA;Ys in the major lipid classes of 3T3-L1 adipocytes in a pulse-chase experiment.
a, Basic design of a pulse-chase experiment. Circles symbolize the wells of the 24-well plate, containing differentiated 3T3-L1 adipocytes. Numbers 11/16/18 refer to the C-count of the input FA;Y (Fig. 2) used at 50 µM for 1 h. After incubation, the media were removed and replaced with chase media for the times indicated. Thereafter, cells were washed and lipids extracted in the presence of internal standards. Extracted lipids were click-reacted with the C175-7x reporter molecules indicated at the right, and samples pooled and subsequently analysed by multiplexed MS1/MS2. Identified labelled species were quantified, summed up and plotted over chase time for the total (b) and separately for TG (c), DG (d), PA (e), PC (f), PE (g) and PI (h). In panels b–e, the sums of single- and multi-labelled species are shown. For PE (g), no double-labelled species were detected; for PI (h), there were very weak signals of double-labelled species that could not be quantified due to lack of a PI;Y2 internal standard. All values are average ± s.d., n = 11–12. Error bars smaller than symbol size are omitted for clarity.

