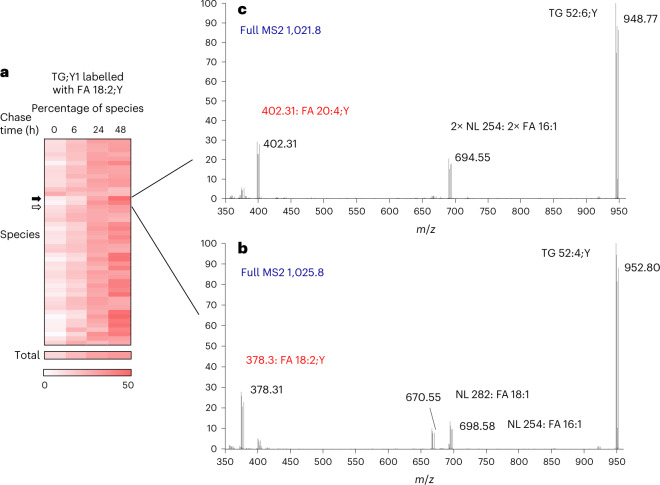
Fig. 5. Detection of modified FA;Y assimilated in labelled lipids of 3T3-L1 adipocytes.
a, Time course of relative abundance of TG;Y1 species upon labelling with FA 18:2;Y. Relative amounts of all TG;Y1 species of the pulse-chase experiment are shown colour-encoded. Each row represents one species. b, MS2 analysis of one species (open arrow) at chase time 48 h. The precursor peak at m/z 1,025.8 is omitted. The four series of fragment peaks indicate the FA composition 16:1_18:1_18:2;Y. c, MS2 analysis of one species (closed arrow) at chase time 48 h. The precursor peak at m/z 1,021.8 is omitted. The three series of fragment peaks indicate the FA composition 16:1_16:1_20:4;Y. Note that in b and c the actual incorporated FA;Ys are directly identified from the peak masses and printed in red. In a, numbers are encoded by intensity of colour (min–max of the entire data block), derived from averages, n = 12. Detailed statistical data of this experiment are shown in the Supplementary Table 2.

