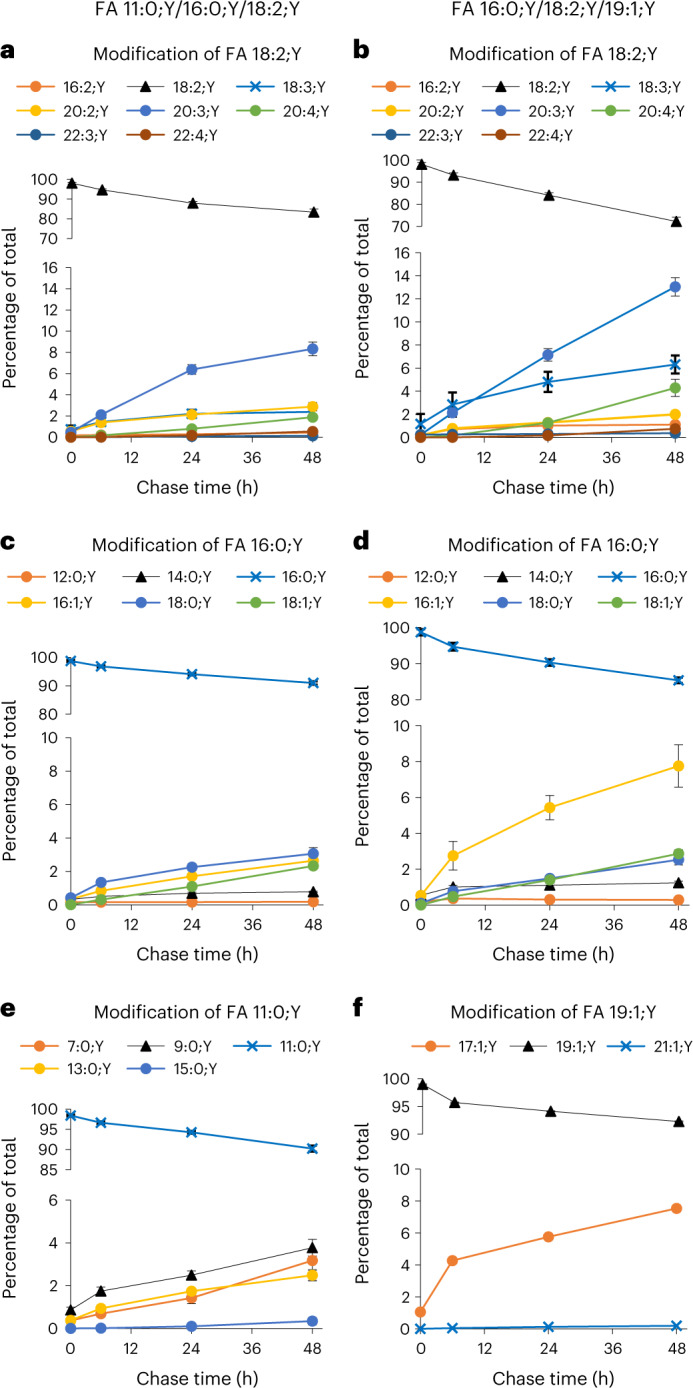
Fig. 6. Time course of FA modification of added FA;Y in 3T3-L1 adipocytes.

3T3-L1 cells were labelled with the FA combination 11:0;Y/16:0;Y/18:2;Y (a,c,e) or 16:0;Y/18:2;Y/19:1;Y (b,d,f) for 1 h, followed by chase periods between 6 h and 48 h, as indicated. FA fragment peaks as illustrated in Fig. 5b,c were detected, identified and quantified in all single-labelled TG;Y1 species. Diagrams show the fraction of each metabolite at the four time points. Metabolites of FA 18:2;Y are shown in panels a and b, of FA 16:0;Y in panels c and d, of FA 11:0;Y in panel e and of 19:1;Y in panel f. All numbers are normalized to the total of the respective FA;Y in TG;Y1 at the respective chase time to compensate for changes in total TG;Y1. Ordinates are split to show the decrease of the input FA;Ys and the increase of their metabolites in one panel. All numbers are average ± s.d., n = 11–12. Error bars smaller than symbol size are omitted for clarity.
