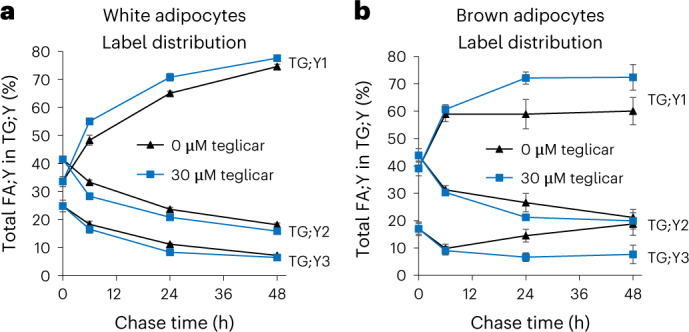
Fig. 7. TG cycling in white and brown adipocytes.

a,b, White (a) and brown (b) adipocytes were labelled with the FA combination 16:0;Y/18:2;Y/19:1;Y for 1 h, followed by chase periods between 6 h and 48 h, as indicated. The diagrams show the distribution of the sum of the three FA;Ys over the TG;Y1, TG;Y2 and TG;Y3 pools, normalized to the total amount of FA;Y in the entire TG;Yn pool. All values are average ± s.d., n = 4 (n = 12 for chase time 0 h). Blue symbols indicate the presence of the CPT1 inhibitor, teglicar, during the chase periods, and black symbols its absence.
