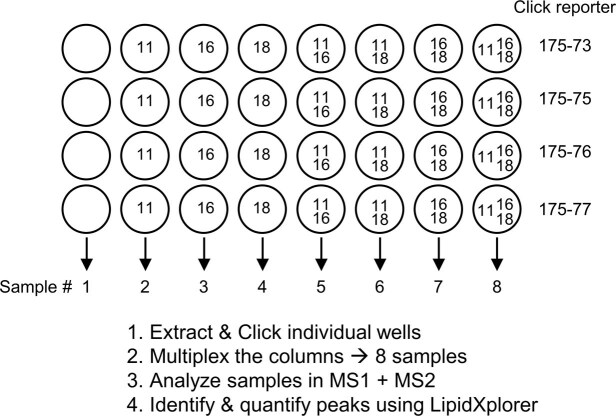
Extended Data Fig. 2. Design and work-flow of the calibration experiment.
Circles symbolize the wells of the 24-well plate, containing differentiated 3T3-L1 adipocytes. Numbers 11/16/18 refer to the above input FA;Y used at 50 µM for 2 h. After incubation, the media were removed, cells washed and lipids extracted in the presence of internal standards. Extracted lipids were click-reacted with the C175-7x reporter molecules indicated at the right. After the reaction, samples were pooled such that one pool contained the four multiplexed replicates with identical input but different click reporters, which were then analyzed by MS1 and MS2, followed by data processing using LipidXplorer (Herzog et al., 2011) software.

