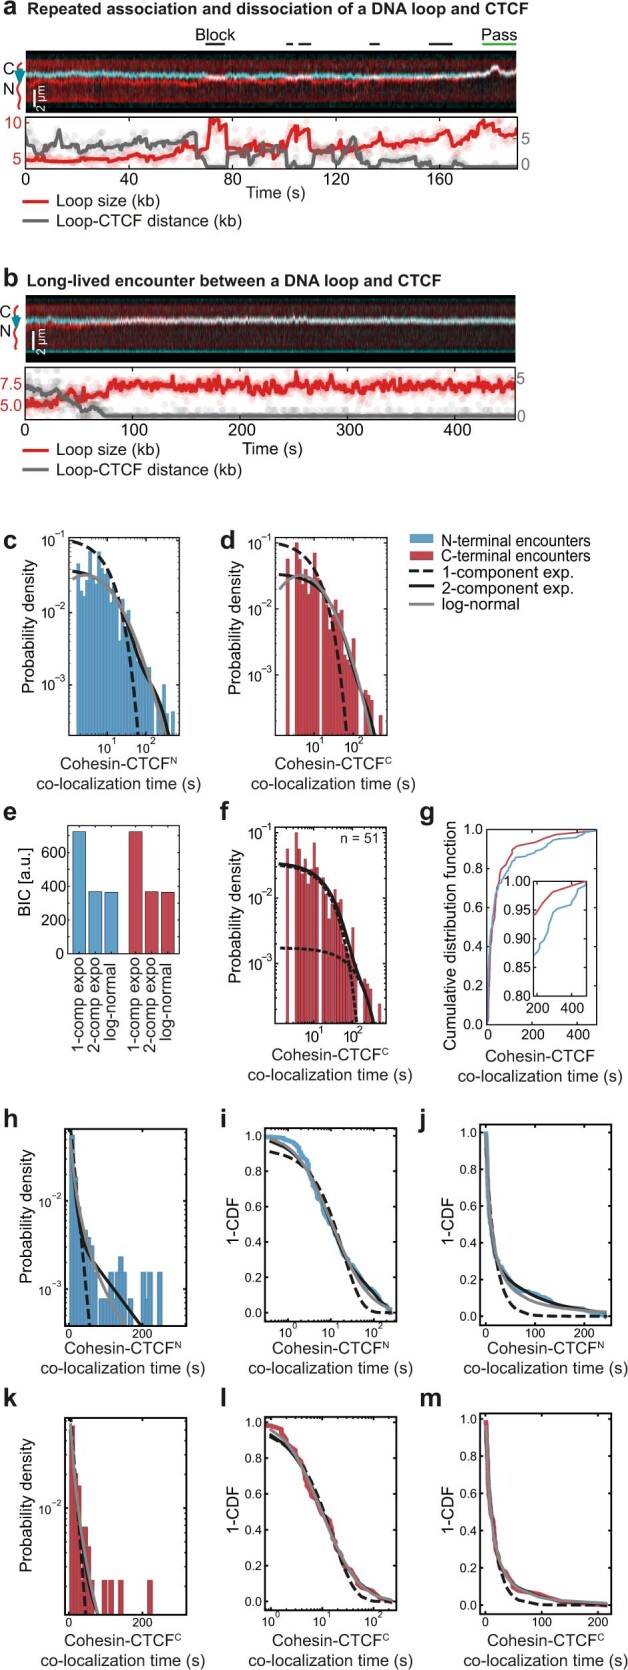
Extended Data Fig. 8. Cohesin-CTCF residence time characterization.

a, Example of repeated approaching of CTCF (cyan) by cohesin, blocking of further loop extrusion and dissociation of the cohesin-CTCF interaction. Cohesin passes CTCF at the end of the kymograph. DNA loops (red) were visualized by Sytox Orange stain. Scale bar, 2 µm. b, Example of a growing loop encountering CTCF (cyan), stalling and co-localizing until the end of image acquisition. DNA loops (red) were visualized by Sytox Orange stain. Scale bar, 2 µm. c, Co-localization times of cohesin for the encounters from the N- and d, C-terminal side of CTCF (N = 147 and N = 51 for N- and C-terminal encounters, respectively). The distributions are fitted to a mono-exponential, bi-exponential and log-normal distribution. e, Bayesian Information Criterion (BIC) for the three models on N- and C-terminal encounters. Notably, both a bi-exponential as well as a log-normal distribution fit the distributions equally well. The parameters of the log-normal fits of the form (xσ√2π)−1 exp((ln(x)-μ)2/(2σ2)) are μ = 3 s, σ = 1.5 s for N-terminal and μ = 3 s, σ = 1.3 s for C-terminal encounters. f, The residence time of encounters between cohesin and CTCF’s C-terminus is well described by a bi-exponential distribution with rate constants k1 = 0.04 s−1 and k2 = 0.01 s−1 (τ1 ~ 25 s and τ2 ~ 100 s). g, Cumulative distribution function of the cohesin-CTCF co-localization time for N- (blue) and C-terminal (red) encounters. Inset: magnified view of co-localization times ≥ 3 min. h, data from panel (c) on a linear x-axis. i, The data in panels (c) and (h) plotted as 1-CDF (Cumulative Distirbution Function) on a logarithmic x-axis. j, the data in panel (i) plotted on a linear x-axis. k–m, as panels (h–j) for encounters of cohesin with C-terminally oriented CTCF.
