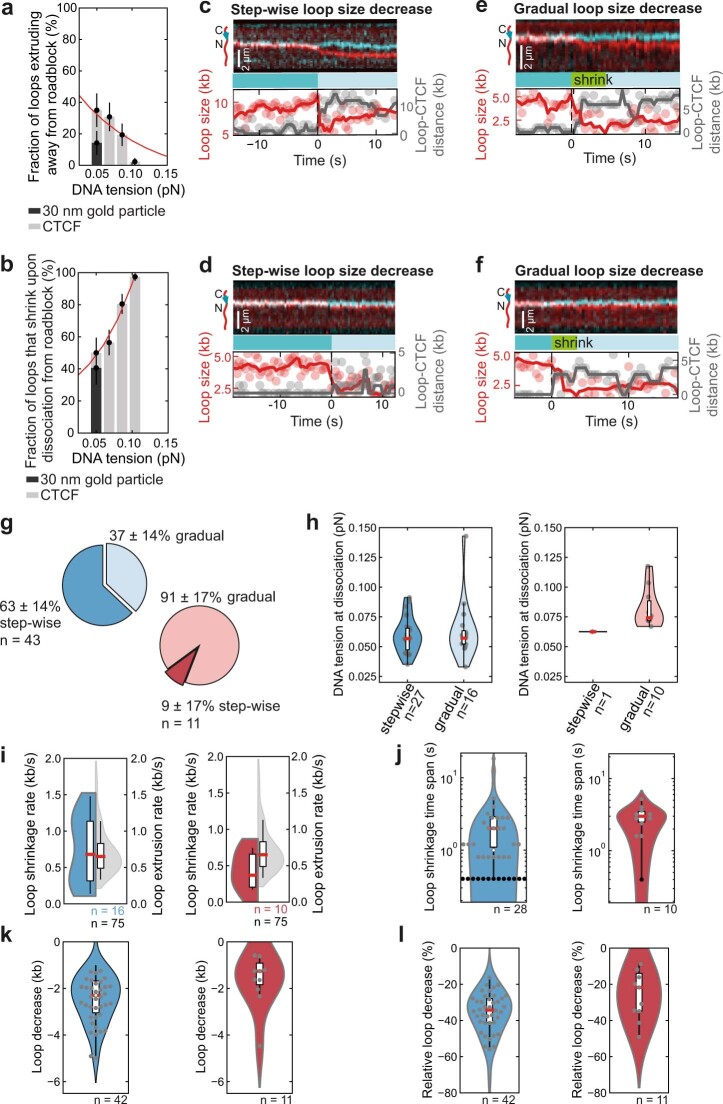
Extended Data Fig. 9. Characterization of direction switching and loop shrinkage following encounters between cohesin and CTCF or gold nanoparticles.
a, The fraction of loops extruding on the side facing away from CTCF (grey bars) or 30 nm gold nanoparticles (black bar; 14 ± 8% [mean ± 95% binomial confidence interval]). CTCF data is replotted from Fig. 3c. Encounters with gold nanoparticles over a force range of 0.02-0.05 pN were reanalysed from46 (N = 21 biological replicates from 2 independent experiments). b, The fraction of loops which shrink upon release from CTCF (grey bars) or 30 nm gold nanoparticles (black bar; 41 ± 10% [mean ± 95% binomial confidence interval]) versus DNA tension at the moment of encounter. CTCF data is replotted from Fig. 3e. Encounters with gold nanoparticles over a force range of 0.02-0.05 pN were reanalysed from46 (N = 22 biological replicates from 2 independent experiments). c-d, Examples of step-wise and e–f, continuous loop shrinkage upon dissociation of cohesin from CTCF. Scale bar, 2 µm. Related to Fig. 3b. g, The fraction of step-wise and continuous loop shrinkage for encounters from the N-terminal (blue) and C-terminal (red) side (mean ± 95% binomial confidence interval). h, DNA tension for loops which shrink step-wise or gradually. There is no statistically significant difference in DNA tension between the two modes (p > 0.05, 2-sided 2-sample Kolmogorov–Smirnov test). i, Loop shrinkage rate, in comparison to cohesin loop extrusion rate (grey), and j, distribution of shrinkage time spans. Black dots represent step-wise shrinkage events that happen within one imaging time interval, i.e. 0.4 s. k, Absolute and l, relative loop size decrease for N- and C-terminal encounters in blue and red, respectively. Thick horizontal lines on boxplots denote median values, the box extends from the lower to upper quartile values and whisker limits denote the range of data within 1.5 times the interquartile range from the median. Data for N-/C-terminal encounters were collected from 13 and 3 independent measurements, respectively.

