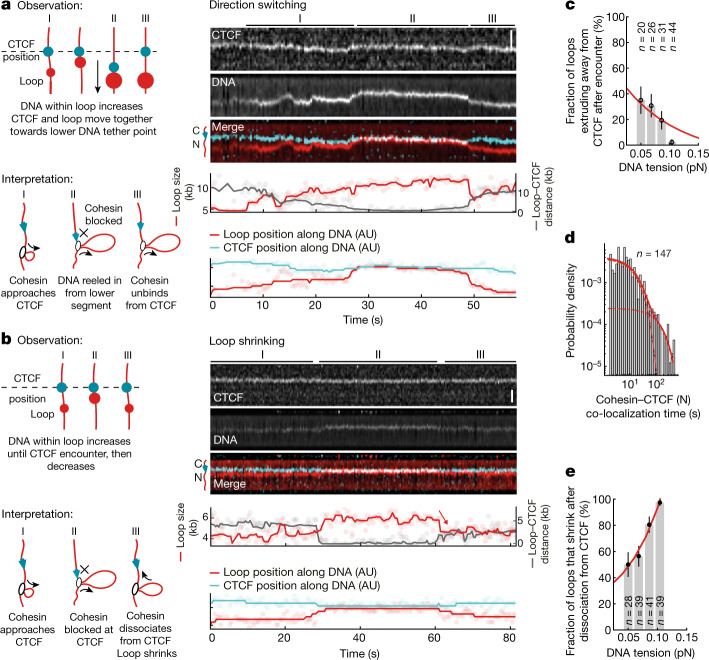
Fig. 3. CTCF changes the direction of cohesin-mediated loop extrusion or induces loop shrinkage, depending on the DNA tension.
a,b, Observation and interpretation illustrations (left) of kymographs of cohesin-mediated DNA loop extrusion encountering N-terminally oriented, JF646-labelled CTCF (cyan) (right). DNA loops (red) were visualized by Sytox Orange. Scale bars, 2 µm. In a, the growing loop encounters CTCF at 28 s. CTCF and the growing DNA loop move towards the lower DNA tether point, indicating extrusion on the side facing away from CTCF. In b, the growth of the DNA loop stops after encountering CTCF at around 29 s. The DNA loop shrinks after dissociation from CTCF at approximately 60 s. AU, arbitrary units. c, The fraction of loops extruding away from CTCF versus the DNA tension at the moment of encounter. Data are mean ± 95% binomial confidence interval; 13 independent experiments. d, The co-localization time of encounters between cohesin and the N terminus of CTCF. The fit denotes a two-component exponential distribution with rate constants k1 = 0.06 s−1 and k2 = 0.006 s−1 (τ1 ≈ 17 s and τ2 ≈ 167 s; data are from 13 independent experiments). The dashed lines represent the individual components of the two-component exponential distribution. The solid line represents the final two-component exponential distribution. e, The fraction of loops that shrink after release from CTCF versus DNA tension at the moment of encounter. Data are mean ± 95% binomial confidence interval; 13 independent experiments. Sample sizes refer to biological replicates.

