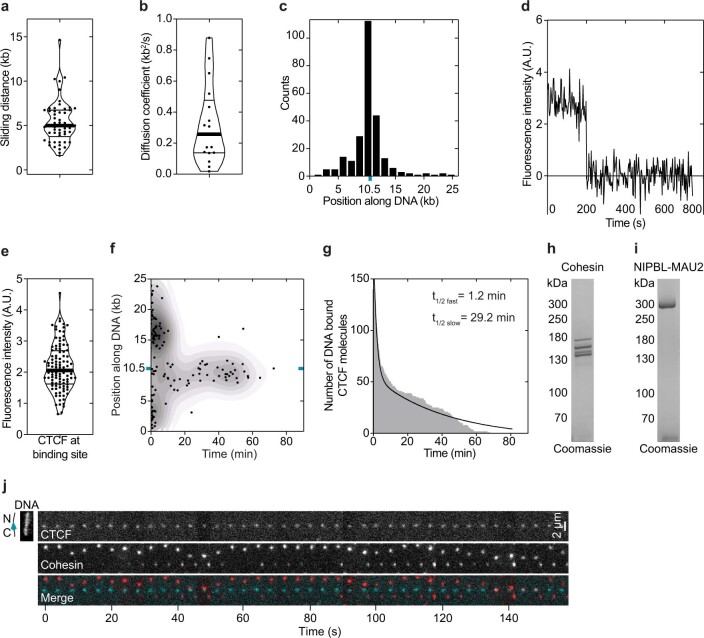
Extended Data Fig. 1. Recombinant CTCF characterization.
a, Distance (kb) travelled by TMR labelled CTCF molecules while diffusing before encountering the CTCF binding site or dissociating. The thick line denotes the median; thin lines denote quartiles. N = 54. b, Diffusion coefficient of diffusing TMR labelled CTCF molecules. The thick line denotes the median; thin lines denote quartiles. N = 17. c, Position of DNA bound TMR labelled CTCF following a brief wash step. The CTCF binding site (cyan tick) is at position 10,452 bp out of 26,123 bp. N = 251. The orientation of the DNA was determined using end-labelling by TetR as shown in Extended Data Fig. 2f. d, Time trace of Alexa 660 (A660)-labelled CTCF signal bound at its DNA binding site bleaching in one step. e, Fluorescence intensity of A660 labelled CTCF signals at the CTCF binding site. N = 104. The thick line denotes the median; thin lines denote quartiles. f, Residence time of TMR labelled CTCF on DNA. The CTCF binding site (cyan tick) is at position 10,452 bp out of 26,123 bp. N = 140. g, Residence time of TMR-labelled CTCF on DNA from (f) plotted as a histogram. Bi-exponential decay curve was fitted using Prism. h-i, Coomassie staining of recombinant cohesin and NIPBL-MAU2 after SDS-PAGE. For gel source data, see Supplementary Fig. 1. j, Example of cohesin diffusion blocked by CTCF. Cohesin and CTCF were labelled with A660 and TMR, respectively. Sytox Green DNA stain was introduced into the flow cell at the end of the experiment. This data is identical to main Fig. 1f except it is formatted as a montage rather than as a kymograph.

