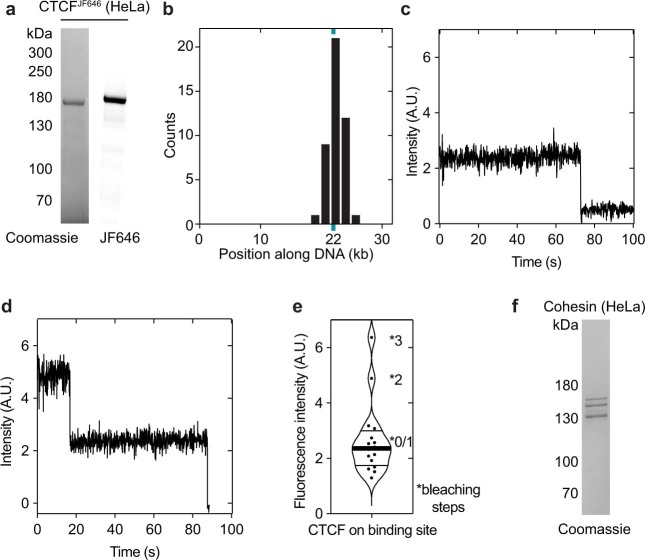
Extended Data Fig. 3. HeLa CTCF characterization.
a, Coomassie staining of HeLa CTCF after SDS-PAGE. JF646 was visualized by epi-red excitation. For gel source data, see Supplementary Fig. 1. b, Position of DNA bound JF646-labelled CTCF following a wash step with a buffer supplemented with 220 nM Sytox Orange. The CTCF binding site (cyan tick) is at position 9,667 bp out of 31,767 bp. N = 251. c, Time trace of JF646-labelled CTCF signal bound at its DNA binding site bleaching in one step. d, Time trace of JF646-labelled CTCF signal bound at its DNA binding site bleaching in two steps. e, Fluorescence intensity of JF646-labelled CTCF signals at the CTCF binding site. The thick line denotes the median; thin lines denote quartiles. N = 16. f, Coomassie staining of HeLa cohesin after SDS-PAGE. For gel source data, see Supplementary Fig. 1.

