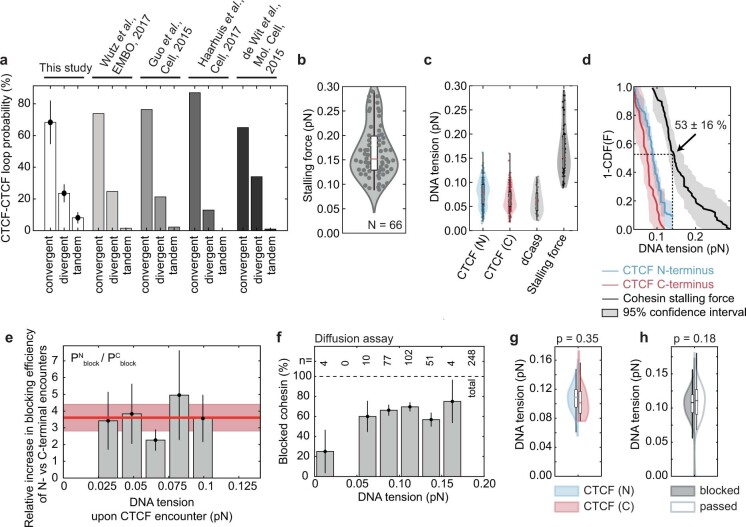
Extended Data Fig. 5. Stalling force of cohesin and force sampling for encounters with the N-/C-terminus of CTCF and dCas9.
a, Combinatorial loop extrusion blocking efficiency at a pair of CTCF sites oriented in a convergent (><), tandem (>> and <<), and divergent (<>) manner. The percentages were obtained by multiplying the blocking probability of N- and C-terminal encounters in the force range 0.04-0.08 pN, as depicted in Fig. 2e, and normalizing to 100% (see Supplementary Note). Bar heights denote mean values. Error bars denote the error propagation after multiplication, given the 95% binomial confidence interval as depicted in Fig. 2e. The relative fraction of CTCF-anchored loops that we obtained from the single-molecule experiments are compared to published values extracted from Hi-C data3,63–65. b, Stalling force of cohesin. horizontal line median; boxes extend to the quartiles and the whiskers show the range of the data (median-1.5* interquartile range (IQR); median+1.5*IQR). Data from 2 independent experiments. c, The DNA tension measured at encounters of loop-extruding cohesin with the N- and C-terminus of CTCF and dCas9. The stalling force values from panel (b) is shown for comparison. N = 297, 184, 37, 66 for CTCF (N), CTCF (C), dCas9 and the stalling force measurements, respectively. d, The empirical survival function (1-CDF) of the data shown in panel c. Thick line represents the mean; shaded areas represent 95% confidence intervals. At the DNA tension of complete stalling at the CTCF N-terminus, 0.14 pN, the survival function decays to 53 16%, i.e. if loops would be halted by reaching the stalling force alone, one would expect ~53% of loops to exceed the DNA tension of 0.14 pN, which was not observed (compare blue line for stalling at the CTCF N-terminus and Fig. 2g). e, Ratio of the N-terminal and C-terminal blocking probabilities. N-terminal encounters block loop extrusion 3.6 ± 0.8 -fold (The bar height denotes the mean, error bars denote the error propagation after multiplication, given the 95% binomial confidence interval as depicted in Fig. 2g) more often than encounters from CTCF’s C-terminal side, independently of DNA tension. N per bin for N-terminal (n) and C-terminal (c) encounters: 0.025-0.0415 pN: 70 (n), 72 (c); 0.0415-0.058 pN: 81 (n), 67 (c); 0.058-0.075 pN: 84 (n), 30 (c); 0.075-0.091 pN: 20 (n), 14 (c); 0.091-0.1075 pN: 40 (n), 6 (c); 0.119-0.142 pN: 3 (n), 0 (c). Sample sizes refer to biological replicates. f, Fraction of blocked molecules in the cohesin diffusion assay as a function of DNA tension (note that the DNA tension is constant in diffusion assays since no DNA loop is being extruded). The bar height denotes the mean, error bars denote the error propagation after multiplication, given the 95% binomial confidence interval. g, DNA tension of DNA molecules on which diffusing cohesin was blocked by N-terminally oriented CTCF (left; N = 74 from 2 independent experiments) or by C-terminally oriented CTCF (right; N = 27 from 5 independent experiments). Statistical significance was assessed by a 2-sided 2-sample Kolmogorov-Smirnoff test. h, Violin plot of DNA tension for DNA molecules on which diffusing cohesin was blocked by CTCF (left; N = 161 from 7 independent experiments) or repeatedly passed CTCF (right; N = 88 from 7 independent experiments). Statistical significance was assessed by a 2-sample Kolmogorov-Smirnoff test. Thick horizontal lines on boxplots denote median values, the box extends from the lower to upper quartile values and whisker limits denote the range of data within 1.5 times the interquartile range from the median.

