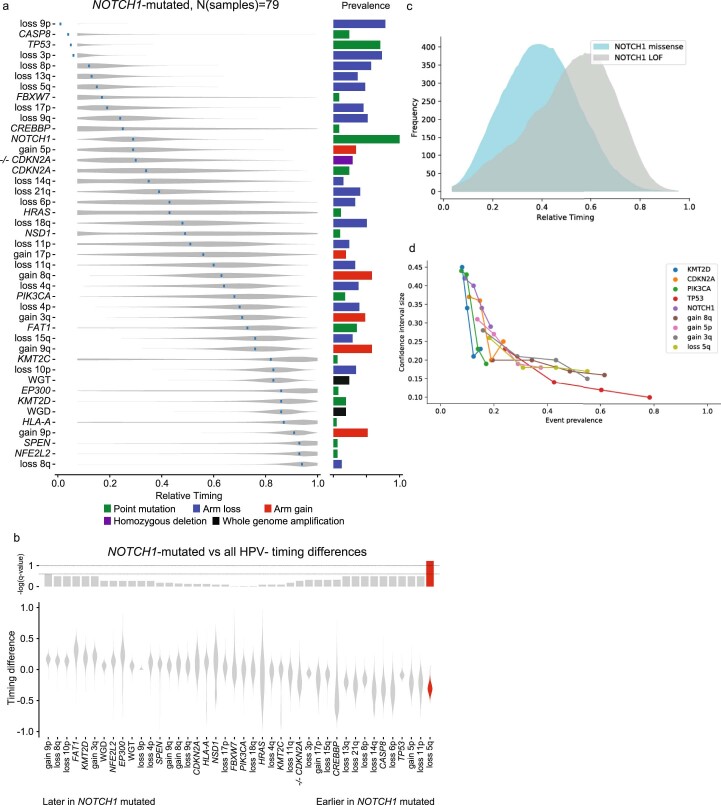
Extended Data Fig. 2. Timing within the NOTCH1-mutated subset of HPV- HNSCC.
(a) Relative Timing of genetic events, based on 79 NOTCH1-mutated HPV-negative HNSCCs. Analysis compared 43 events among tumors: whole-genome amplification (WGD, doubling; WGT, triploidy) and other events with notable prevalence among HPV-negative tumors (arm losses with > 30% prevalence, SNV with > 5% prevalence). (b) Relative timing between NOTCH1-mutated and all HPV-negative tumors of 42 events (all events from panel a excluding NOTCH1) (N = 79 NOTCH1-mutated patients). Violin plots show the distributions of difference in timing between the groups. Associated log10 q-values are displayed at the top. (c) MRT timing profiles for NOTCH1 activating and deactivating mutations (d) Power analysis through down sampling of higher prevalence events, demonstrating dependence of the confidence interval size on event prevalence (N = 421 HPV- patients).

