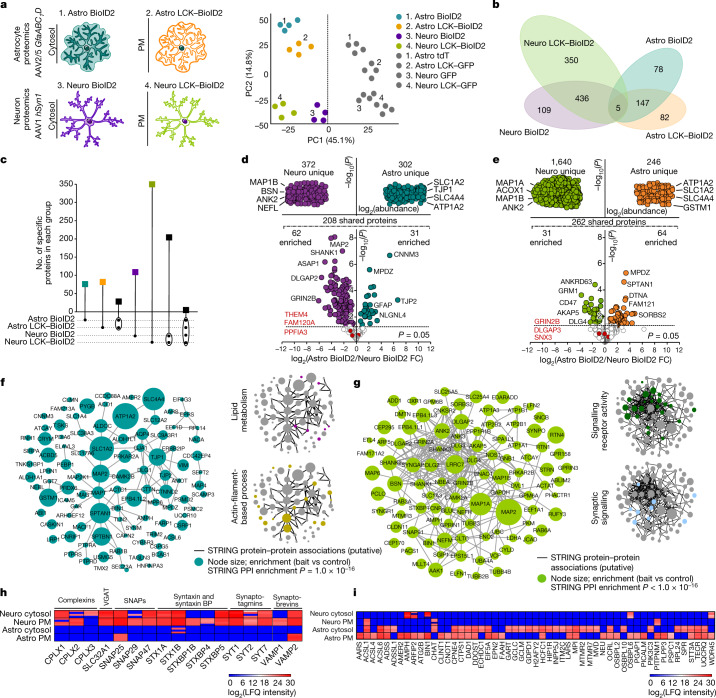
Fig. 1. Striatal astrocyte and neuron proteomes.
a, Left, cartoons representing genetically targeted BioID2 in the cytosol and PM of astrocytes and neurons. Right, PCA plot of all proteins detected by mass sepctrometry (n = 4 technical runs per construct with 8 mice each). b, Clustergram depicting the specific number of proteins detected in each BioID2 construct experiment of astrocytes and neurons. All proteins hereafter represent those that were significant (log2(fold change (FC)) > 1 and FDR < 0.05 versus GFP controls). c, UpSet plot of BioID2-identified proteins. d, LFQ comparison of proteins detected by cytosolic Astro BioID2 and Neuro BioID2. Top, proteins specific to Neuro BioID2 or Astro BioID2 when compared with each other. The four most abundant proteins are named. Bottom, comparison of proteins that were shared in both cytosolic Astro BioID2 and Neuro BioID2. The five highest enriched proteins (log2(FC) > 2) are indicated. The top three proteins that showed no enrichment in either cell are depicted in red. e, As in d but for PM Astro BioID2 and Neuro BioID2. f, Left, STRING analysis map of the top 100 proteins identified with Astro BioID2 and Astro LCK–BioID2. Node size represents the enrichment of each protein versus the GFP control. Edges represent putative interactions from STRING. Right, small clustergrams show categories for biological process. PPI, protein–protein interaction. g. As in f, but for Neuro BioID2 and Neuro LCK–BioID2. h, Expression levels (LFQ intensity) of Ca2+-dependent vesicle release proteins identified by each BioID2 construct. BPs, binding proteins. i, Expression levels of proteins related to lipid metabolism identified in each BioID2 construct.

