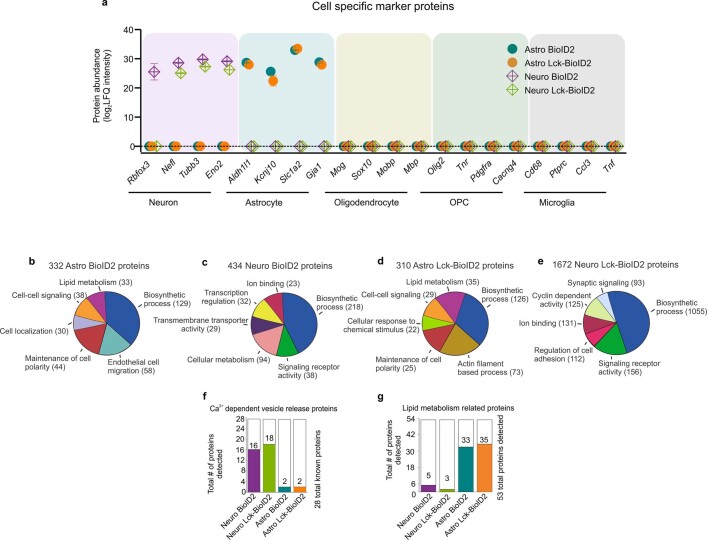
Extended Data Fig. 5. Broad assessments of BioID2 detected proteins.
a. Expression levels (in label-free quantification intensity, LFQ intensity) of cell-enriched markers identified in each BioID2 construct (n = 4 experimental runs with 8 mice in each run). Proteins in this analysis represent proteins that were enriched (Log2FC > 1 versus GFP controls). The mean LFQ value and SEM are shown. b. Pie chart of PANTHER pathway analysis terms for “biological processes”. Pie chart shows the number of proteins found for each term from the 332 Astro BioID2 proteins. c. As in b, but for the 434 Neuro BioID2 proteins. d. As in b, but for 310 Astro Lck-BioID2 proteins. e. As in b, but for the 1672 Neuro Lck-BioID2 proteins. f. Bar graph denotes the number of calcium dependent vesicle release protein isoforms detected in each BioID2 construct experiment. g. Bar graph denotes the number of lipid metabolism related proteins that were detected in each BioID2 construct experiment.

