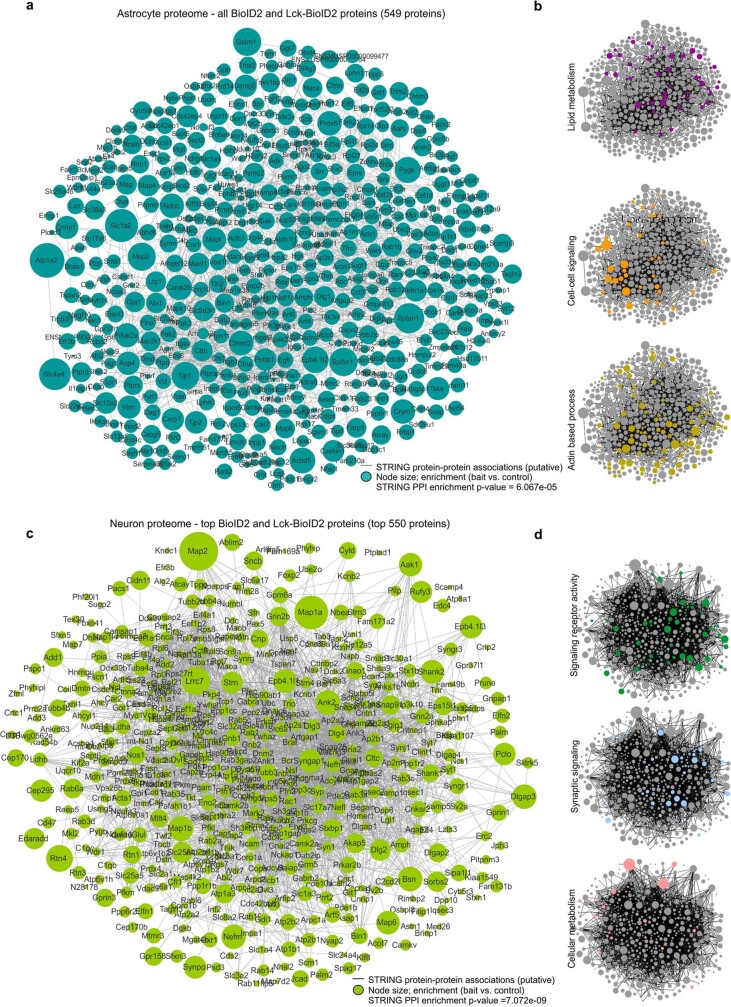
Extended Data Fig. 6. Interaction maps for the astrocyte and neuron proteomes.
a. Scale-free STRING analysis protein-protein association map of all the 549 unique and enriched biotinylated proteins identified in astrocytes with Astro BioID2 and Astro Lck-BioID2 . Node size represents the enrichment of each protein vs the GFP control (log2(BioID2/GFP)). Edges represent putative interactions from the STRING database. b. Small clustergrams show selected functional categories from Panther GO analysis for “biological process” in different colors. c. Scale-free STRING analysis interaction map of the top 550 unique and enriched biotinylated proteins identified in neurons with Neuro BioID2 and Neuro Lck-BioID2. Node size represents the enrichment of each protein vs the GFP control (log2(BioID2/GFP)). Edges represent known interactions from the STRING database. d. Small clustergrams show selected functional categories from Panther GO analysis for “biological process” in different colors.

