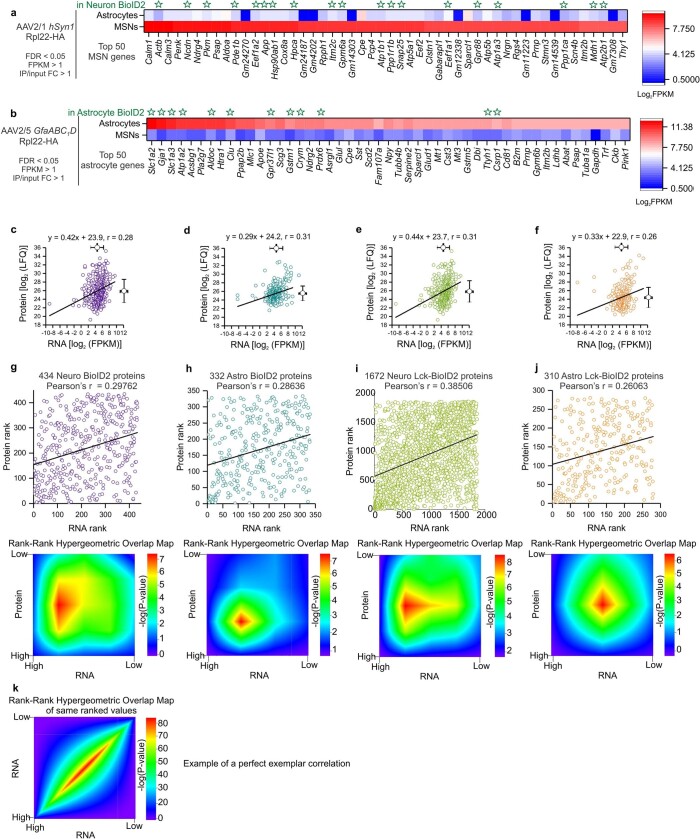
Extended Data Fig. 7. Detailed analyses comparing RNA-seq and proteomic data.
a. Top 50 medium spiny neuron (MSN) genes found by neuron-specific RiboTag AAV RNA-sequencing listed by the highest expression value (fragments per kilobase per million, FPKM). Astrocyte expression values for the top 50 MSN genes are shown. Green stars label gene products that were found at the proteomic level in Neuro BioID2 or Neuro Lck-BioID2. Scale shows Log2FPKM. b. Top 50 astrocyte genes found by astrocyte-specific RiboTag AAV RNA-sequencing listed by the highest expression value (fragments per kilobase per million, FPKM). Neuronal expression values for the top 50 astrocyte genes are shown. Green stars label gene products that were found at the proteomic level in Astro BioID2 or Astro Lck-BioID2. Scale shows Log2FPKM. c. Scatter graph showing protein expression (Log2LFQ intensity) as a function of mRNA expression (Log2FPKM) for the 434 Neuro BioID2 proteins identified. Pearson’s r is shown. d. Scatter graph showing protein expression (Log2LFQ intensity) as a function of mRNA expression (Log2FPKM) for the 332 Astro BioID2 proteins identified. Pearson’s r is shown. e. Scatter graph showing protein expression (Log2LFQ intensity) as a function of mRNA expression (Log2FPKM) for the 1672 Neuro Lck-BioID2 proteins identified. Pearson’s r is shown. f. Scatter graph showing protein expression (Log2LFQ intensity) as a function of mRNA expression (Log2FPKM) for the 310 Astro Lck-BioID2 proteins identified. Pearson’s r is shown. g. Scatter graph showing the protein rank (by LFQ abundance) as a function of mRNA rank (by FPKM abundance) of the 434 Neuro BioID2 proteins identified. Two-tailed Pearson’s r is shown. Heat map shows the rank-rank hypergeometric overlap (RRHO) of the RNA and protein rank. Each pixel represents the significance of overlap between the two datasets in –log10(P-value). Red pixels represent highly significant overlap. Color scale denotes the range of P-values at the negative log10 scale (Bin size = 100). h. Scatter graph showing the protein rank (by LFQ abundance) as a function of mRNA rank (by FPKM abundance) of the 332 Astro BioID2 proteins identified. Two-tailed Pearson’s r is shown. Heat map shows the rank-rank hypergeometric overlap (RRHO) of the RNA and protein rank. (Bin size = 100). i. Scatter graph showing the protein rank (by LFQ abundance) as a function of mRNA rank (by FPKM abundance) of the 1672 Neuro Lck-BioID2 proteins identified. Two-tailed Pearson’s r is shown. Heat map shows the rank-rank hypergeometric overlap (RRHO) of the RNA and protein rank (Bin size = 100). j. Scatter graph showing the protein rank (by LFQ abundance) as a function of mRNA rank (by FPKM abundance) of the 310 Astro Lck-BioID2 proteins identified. Two-tailed Pearson’s r is shown. Heat map shows the rank-rank hypergeometric overlap (RRHO) of the RNA and protein rank. (Bin size = 100). k. Heat map shows and simulated rank-rank hypergeometric overlap (RRHO) of the mRNA of the 434 Neuro BioID2 proteins versus the very same idealized mRNA of the 434 proteins. (Bin size = 100).

