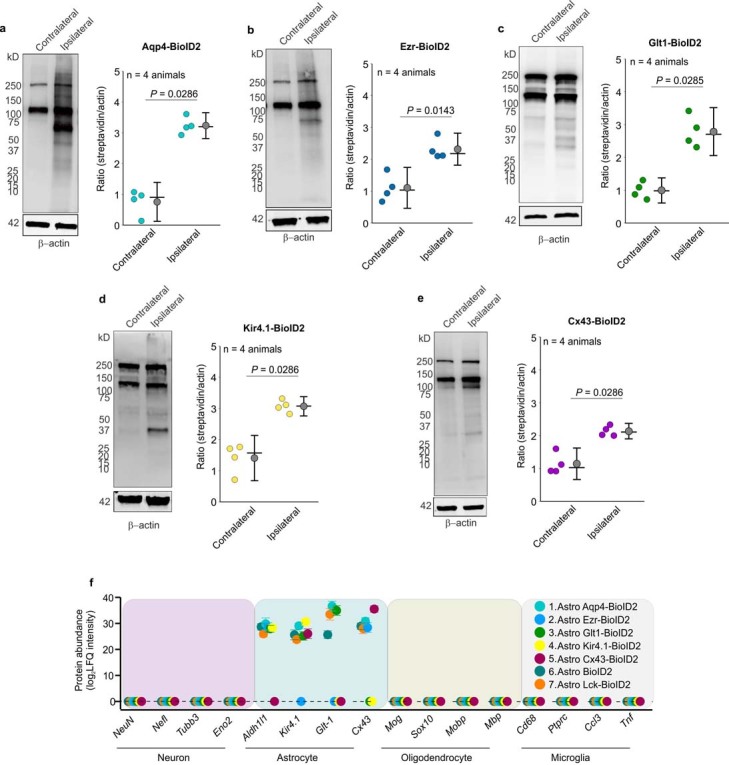
Extended Data Fig. 10. Biotinylation assessments of subcompartment BioID2 constructs.

a. Western blot analysis of brain unilaterally microinjected with astrocyte specific Aqp4-BioID2. Dark bands at 130 kD and 250 kD show the endogenously biotinylated mitochondrial proteins, Pyruvate carboxylase and acetyl-CoA carboxylase. Graph depicting the streptavidin signal intensity divided by the β-actin signal intensity for each data point. Black horizontal line depicts the mean, circle represents the median, and error bars show the SEM (n = 4 mice; Mann-Whitney test). b-e. As in a, but for Ezrin-BioID2 (b), Glt1-BioID2 (c), Kir4.1-BioID2 (d), and Cx43-BioId2 (e) (n = 4 mice in each case; Two-tailed Mann-Whitney test). f. Expression levels (in label-free quantification intensity, LFQ intensity) of cell-enriched markers identified in each astrocytic sub-compartment BioID2 construct (n = 4 experimental runs). Proteins in this analysis represent proteins that were enriched (Log2FC > 1 versus GFP controls). The mean LFQ value and SEM are shown. For blot source data, see Supplementary Fig. 1.
